Fig. 40.
Download original image
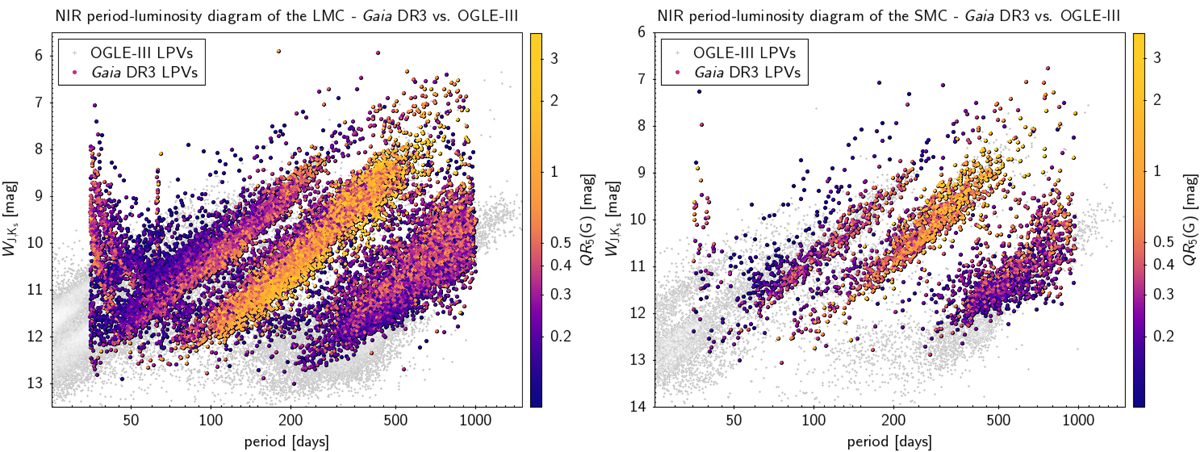
Period-luminosity diagram, with the 2MASS NIR Wesenheit index WJ,K_s4.5pt, of Gaia DR3 LPVs that are candidate members of the LMC (left panel) and SMC (right panel; using the selection criteria of Mowlavi et al. 2019). Data points are colour-coded by their G-band amplitude (5–95% interquantile range). Data from the OGLE-III catalogue are shown as grey symbols in the background for reference.
Current usage metrics show cumulative count of Article Views (full-text article views including HTML views, PDF and ePub downloads, according to the available data) and Abstracts Views on Vision4Press platform.
Data correspond to usage on the plateform after 2015. The current usage metrics is available 48-96 hours after online publication and is updated daily on week days.
Initial download of the metrics may take a while.