Fig. 4.
Download original image
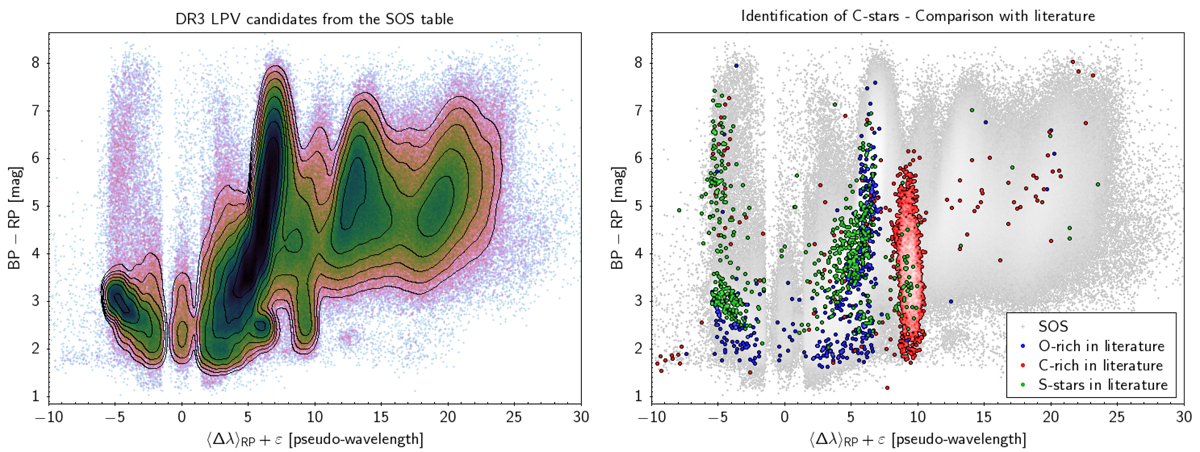
Density-mapped distribution of the LPV candidates from the SOS table in the ⟨Δλ⟩RP vs. GBP − GRP plane. Density contour lines are displayed in the left panel to highlight patterns in the diagram. In the right panel, sources spectroscopically identified in the literature as O-rich (blue), C-rich (red), or S-stars (green) are displayed on top of the data from the SOS table. Random artificial errors −0.5 ≤ ε ≤ 0.5 have been applied to ⟨Δλ⟩RP for visualisation purposes, in order to smooth out the artificial clustering of that parameter around a discrete set of value.
Current usage metrics show cumulative count of Article Views (full-text article views including HTML views, PDF and ePub downloads, according to the available data) and Abstracts Views on Vision4Press platform.
Data correspond to usage on the plateform after 2015. The current usage metrics is available 48-96 hours after online publication and is updated daily on week days.
Initial download of the metrics may take a while.