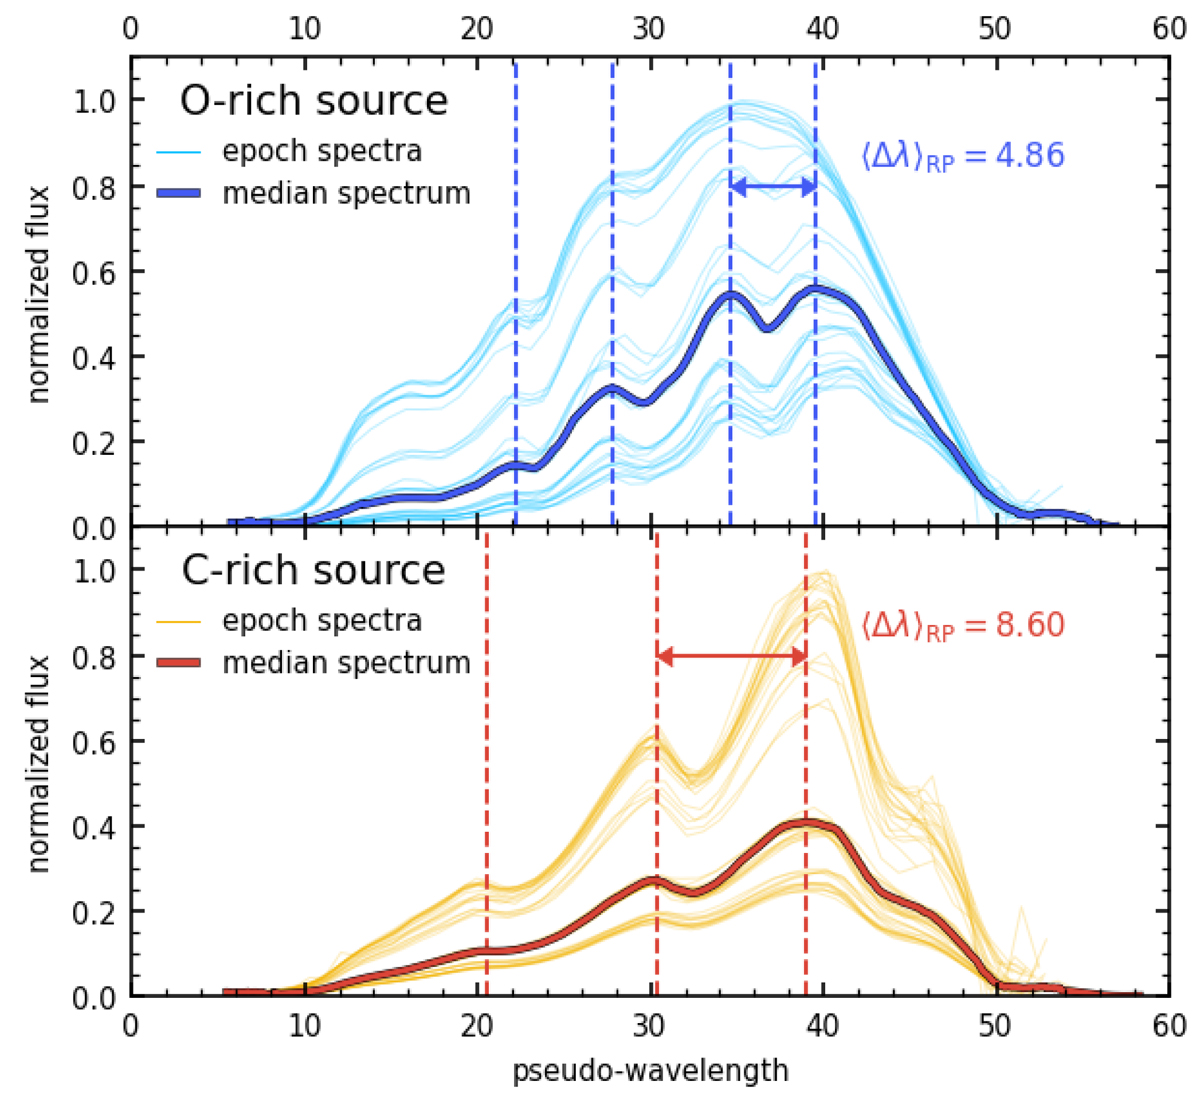
Fig. 3.
Download original image
Low-resolution RP spectra of the O-rich star T Aqr (top panel) and of the C-rich star RU Vir (bottom panel). Thin lines represent epoch spectra, and the thick, darker lines are median spectra. Vertical dashed lines indicate the value of the pseudo-wavelength at the most prominent peaks of the median spectra. The arrows mark the distance in pseudo-wavelength between the two highest peaks, ⟨Δλ⟩RP, whose value is indicated. This is the adapted version of the figure published as Gaia image of the week IoW_20181115.
Current usage metrics show cumulative count of Article Views (full-text article views including HTML views, PDF and ePub downloads, according to the available data) and Abstracts Views on Vision4Press platform.
Data correspond to usage on the plateform after 2015. The current usage metrics is available 48-96 hours after online publication and is updated daily on week days.
Initial download of the metrics may take a while.