Fig. 21.
Download original image
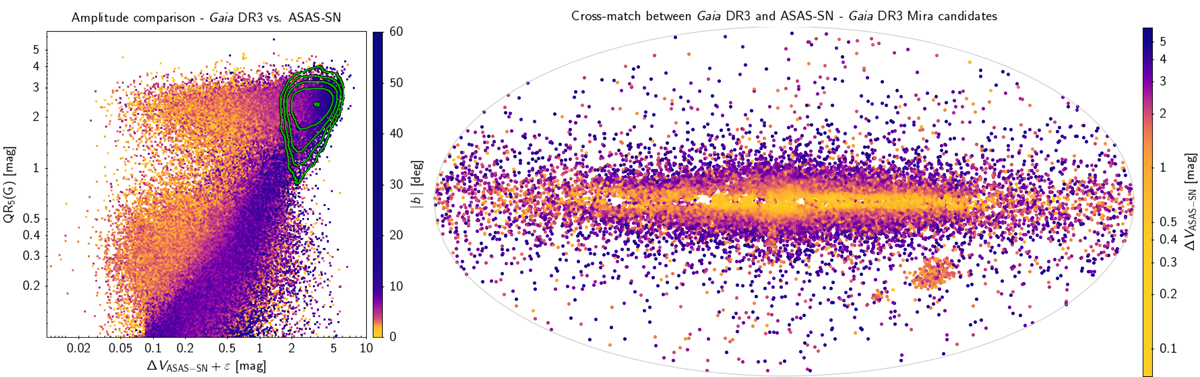
Comparison of the G-band amplitude (QR5(G)) of Gaia DR3 LPV candidates and the V-band amplitude ΔV of their best-match ASAS-SN sources. Left panel: direct comparison, limited to sources that are classified as LPVs in ASAS-SN. Data points are colour-coded according to the absolute value of their Galactic latitude, and the green density contour lines show the location of ASAS-SN sources that are classified as miras. Right panel: distribution in Galactic coordinates of the same sample, but limited to QR5(G) > 1 mag (i.e. sources with a large enough Gaia amplitude to be considered mira candidates), colour-coded by the value of the ASAS-SN amplitude. We note that random artificial errors −0.01 ≤ ε ≤ 0.01 have been added to the ASAS-SN amplitudes in the left panel to smooth out artefacts (evident in logarithmic scale) caused by the limited precision with which these values are provided.
Current usage metrics show cumulative count of Article Views (full-text article views including HTML views, PDF and ePub downloads, according to the available data) and Abstracts Views on Vision4Press platform.
Data correspond to usage on the plateform after 2015. The current usage metrics is available 48-96 hours after online publication and is updated daily on week days.
Initial download of the metrics may take a while.