Fig. 2.
Download original image
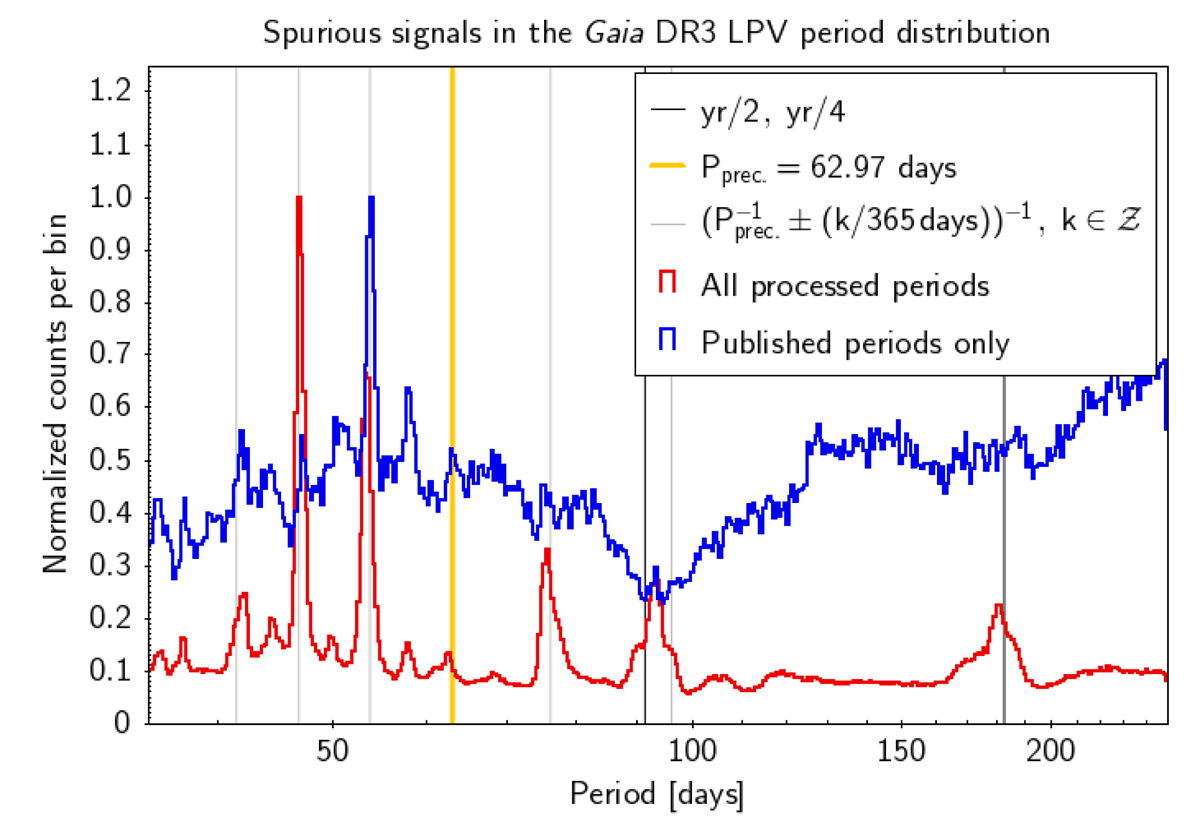
Spurious signals in the period distribution. The histograms show the distribution of periods derived for all Gaia DR3 LPV candidates (red) and limited to the published periods (blue), showing the substantial reduction of spurious signals in the latter. Vertical lines mark the periods equal to half a year and one quarter of a year (black), the alias caused by the Gaia spacecraft precession period Pprec. = 62.97 days (yellow), and the spurious signals caused by the interaction of the latter with the yearly observing window of Gaia. For visualisation purposes, both histograms are limited to the range of 35–250 days, and normalised to their maximum value over that interval.
Current usage metrics show cumulative count of Article Views (full-text article views including HTML views, PDF and ePub downloads, according to the available data) and Abstracts Views on Vision4Press platform.
Data correspond to usage on the plateform after 2015. The current usage metrics is available 48-96 hours after online publication and is updated daily on week days.
Initial download of the metrics may take a while.