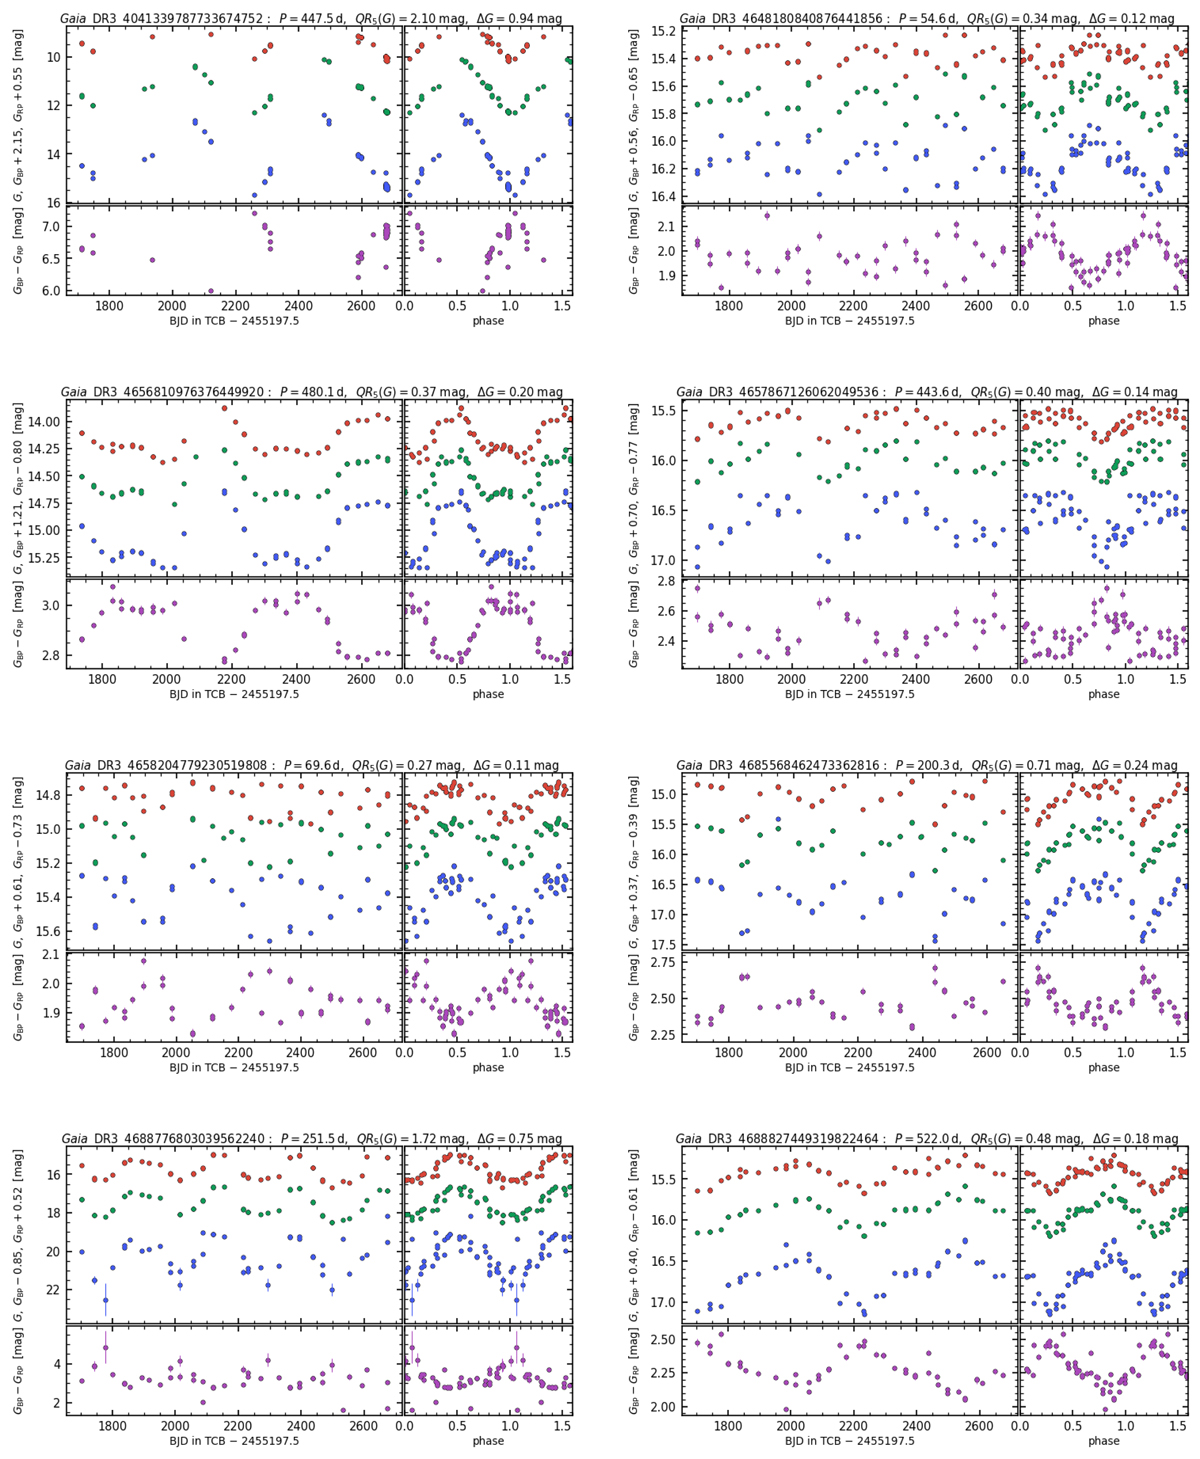
Fig. 17.
Download original image
Example Gaia DR3 time series of LPV candidates. The GBP and GRP time series are offset by arbitrary amounts (indicated in the labels of the vertical axes) for visualisation purposes. The green, blue, and red symbols represent time series in the G, GBP, and GRP filters. When the latter two are simultaneous (within 10 seconds of each other), the colour GBP − GRP is displayed in purple.
Current usage metrics show cumulative count of Article Views (full-text article views including HTML views, PDF and ePub downloads, according to the available data) and Abstracts Views on Vision4Press platform.
Data correspond to usage on the plateform after 2015. The current usage metrics is available 48-96 hours after online publication and is updated daily on week days.
Initial download of the metrics may take a while.