Open Access
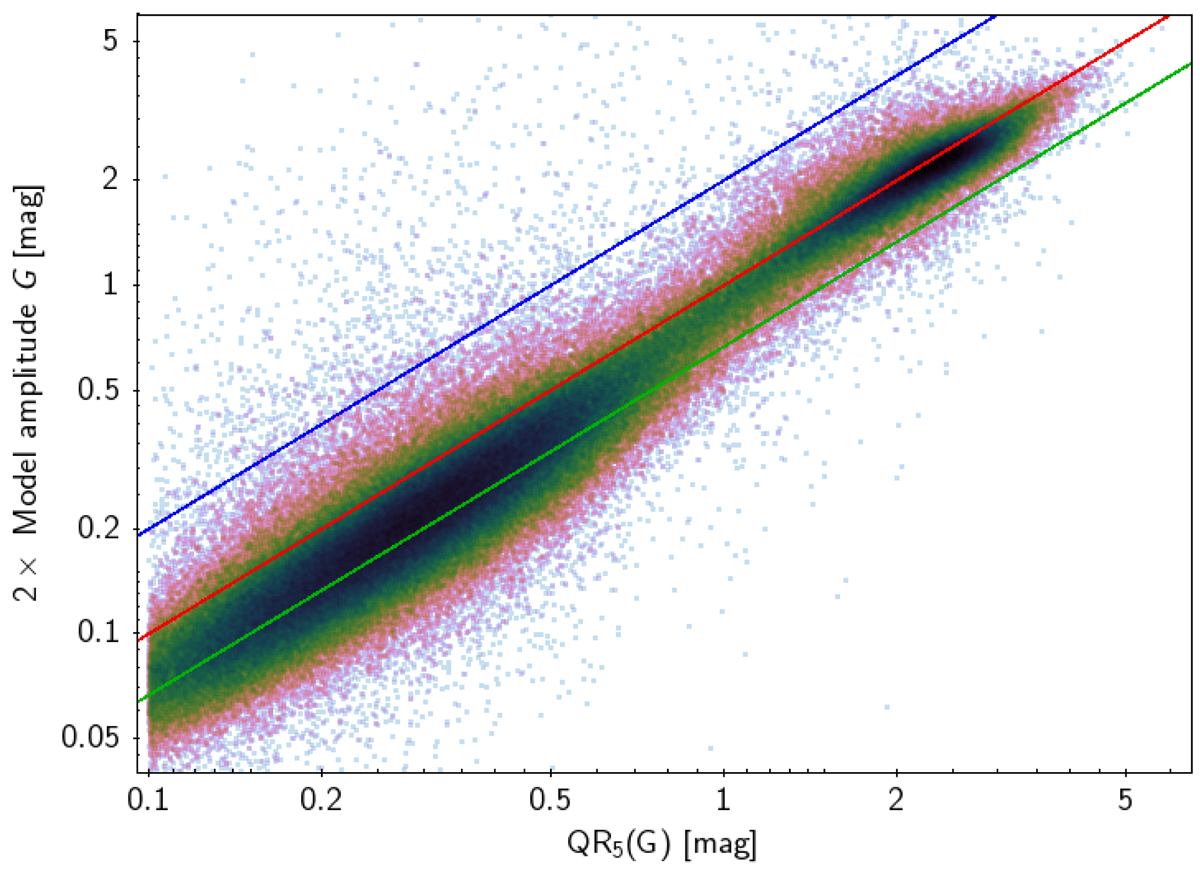
Fig. 14.
Download original image
Twice the best-fit model amplitude in the G band compared to the 5–95% interquantile range QR5(G) for the Gaia DR3 LPV sources whose period has been retained for publication. The blue, red, and green lines (from top to bottom) indicate where the model amplitude equals 2 QR5(G), QR5(G), or 2/3 QR5(G).
Current usage metrics show cumulative count of Article Views (full-text article views including HTML views, PDF and ePub downloads, according to the available data) and Abstracts Views on Vision4Press platform.
Data correspond to usage on the plateform after 2015. The current usage metrics is available 48-96 hours after online publication and is updated daily on week days.
Initial download of the metrics may take a while.