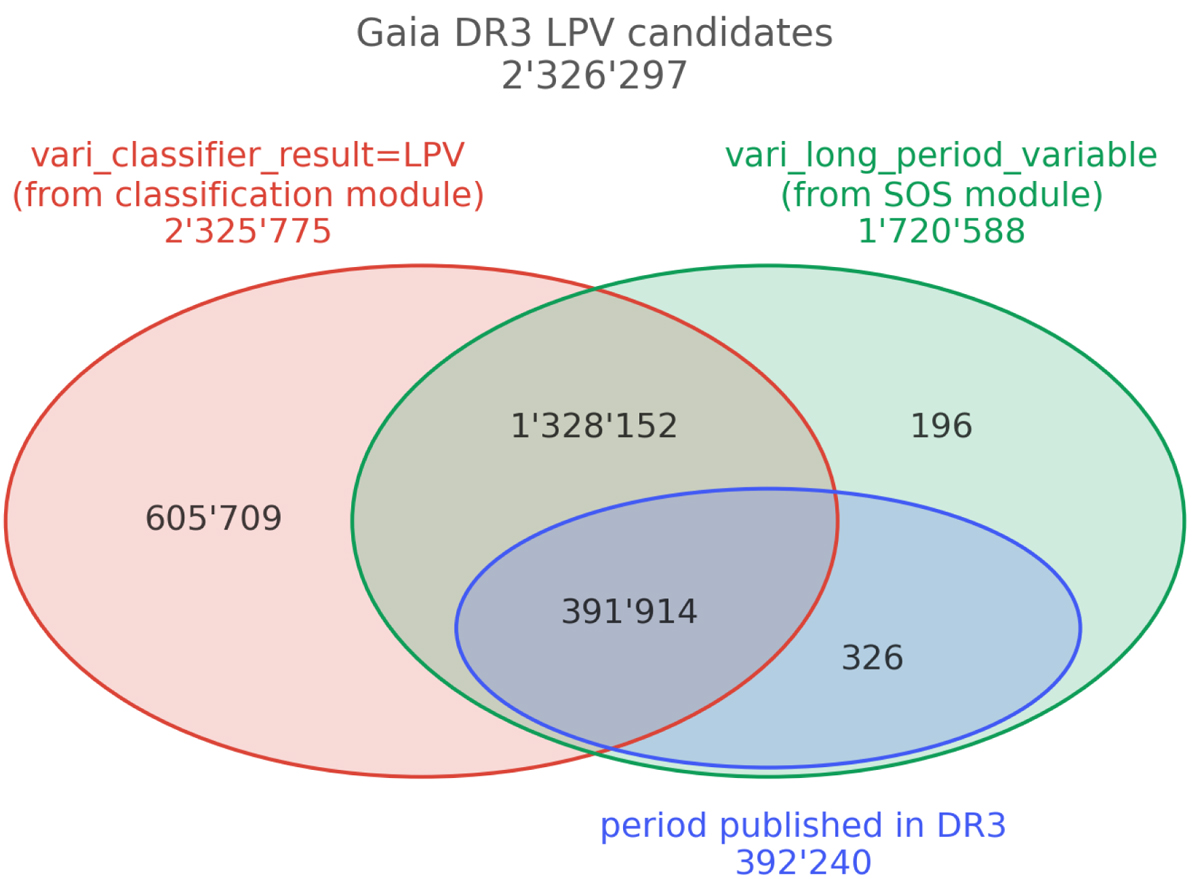
Fig. 1.
Download original image
Venn diagram of the repartition of the Gaia DR3 LPV candidates in the vari_classifier_result table with best_class_name=LPV (red, left in the figure) and vari_long_period_variable table (green, right in the figure) published in Gaia DR3. The figure also illustrate the subset of sources whose period is published in Gaia DR3, all of which are part of the vari_long_period_variable table. All sources, except one, are present in vari_classifier_result, but not necessarily with best_class_name=LPV (see text).
Current usage metrics show cumulative count of Article Views (full-text article views including HTML views, PDF and ePub downloads, according to the available data) and Abstracts Views on Vision4Press platform.
Data correspond to usage on the plateform after 2015. The current usage metrics is available 48-96 hours after online publication and is updated daily on week days.
Initial download of the metrics may take a while.