Open Access
Fig. 6.
Download original image
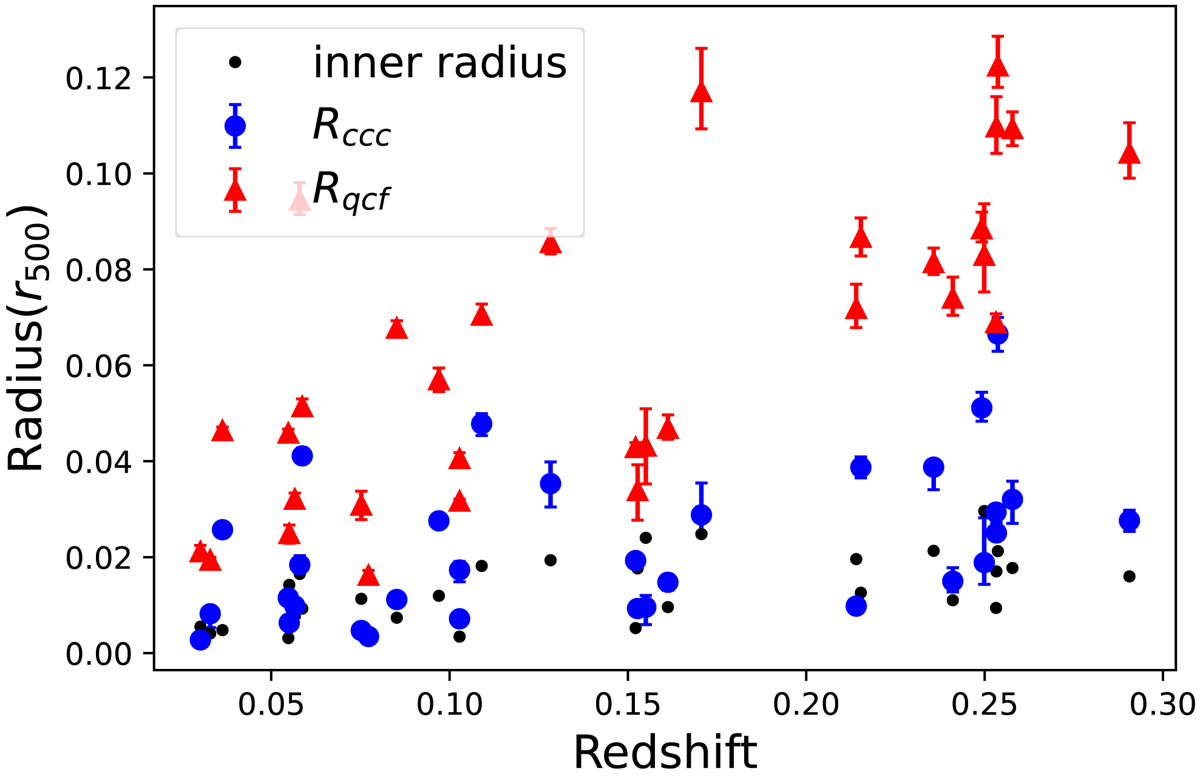
Quenched cooling flow radius Rqcf (red) and the cool-core condensation radius Rccc (blue) plotted versus redshift. The black dots show the size of the innermost bins, to visualize of how well we are able to resolve the inner regions compared with the Rqcf values.
Current usage metrics show cumulative count of Article Views (full-text article views including HTML views, PDF and ePub downloads, according to the available data) and Abstracts Views on Vision4Press platform.
Data correspond to usage on the plateform after 2015. The current usage metrics is available 48-96 hours after online publication and is updated daily on week days.
Initial download of the metrics may take a while.