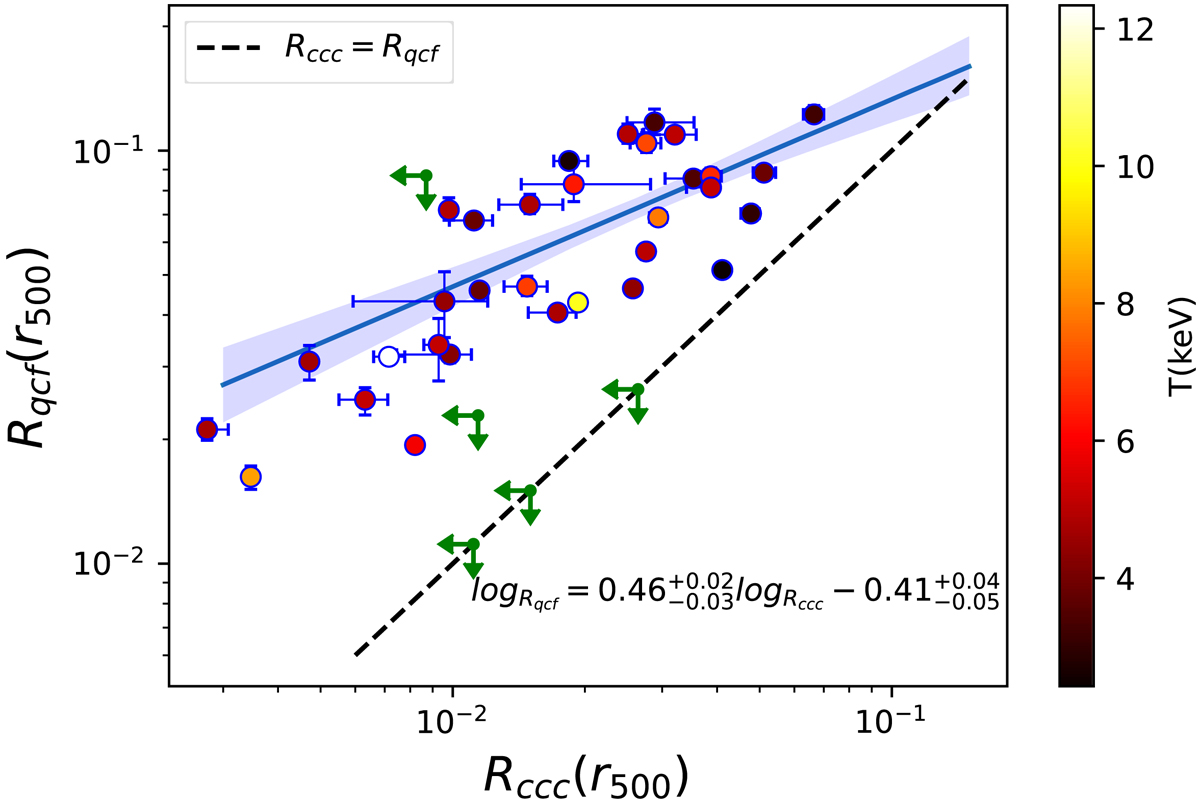
Fig. 4.
Download original image
Quenched cooling flow radius Rqcf plotted against the cool-core condensation radius Rccc, including the upper limits in Rqcf and Rccc (green arrows). The solid line is the best-fit power law relation (with 1-σ uncertainty shown by the shaded area), while the dashed line shows Rqcf ∝ Rccc with arbitrary normalization. The color of each point is color coded according to the temperature of each cluster. Error bars correspond to 1-σ confidence level.
Current usage metrics show cumulative count of Article Views (full-text article views including HTML views, PDF and ePub downloads, according to the available data) and Abstracts Views on Vision4Press platform.
Data correspond to usage on the plateform after 2015. The current usage metrics is available 48-96 hours after online publication and is updated daily on week days.
Initial download of the metrics may take a while.