Fig. 1.
Download original image
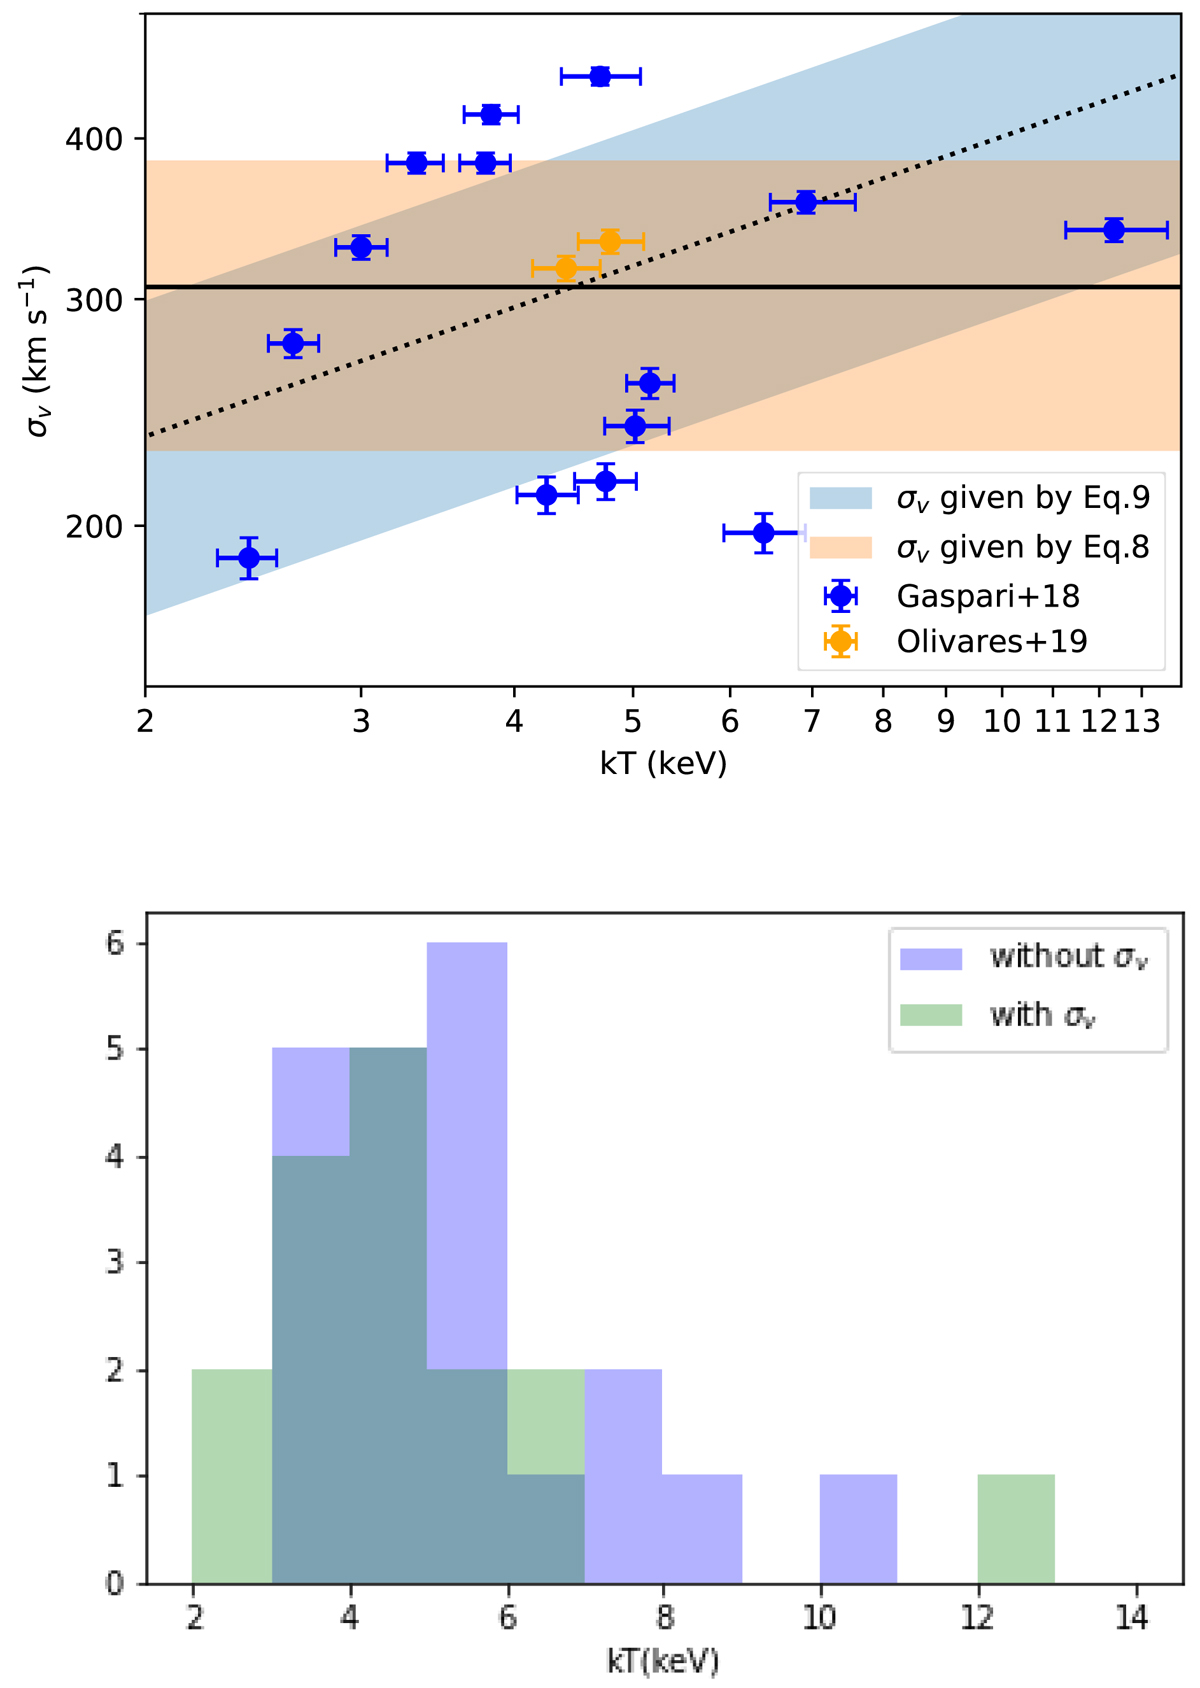
Top panel: Turbulent velocity values measured in the warm or cold phase by Gaspari et al. (2018, blue points) and Olivares et al. (2019, orange points). The reference dotted line σ ∝ T1/3 corresponds to Eq. (9), with the cyan-shaded area showing the 1σ uncertainty. The solid lined corresponds to the constant average value given by Eq. (8), with the orange-shaded area showing its 1σ uncertainty. Bottom panel: the histogram distribution of the clusters with σv measurement (blue) and of the complementary subsample (green).
Current usage metrics show cumulative count of Article Views (full-text article views including HTML views, PDF and ePub downloads, according to the available data) and Abstracts Views on Vision4Press platform.
Data correspond to usage on the plateform after 2015. The current usage metrics is available 48-96 hours after online publication and is updated daily on week days.
Initial download of the metrics may take a while.