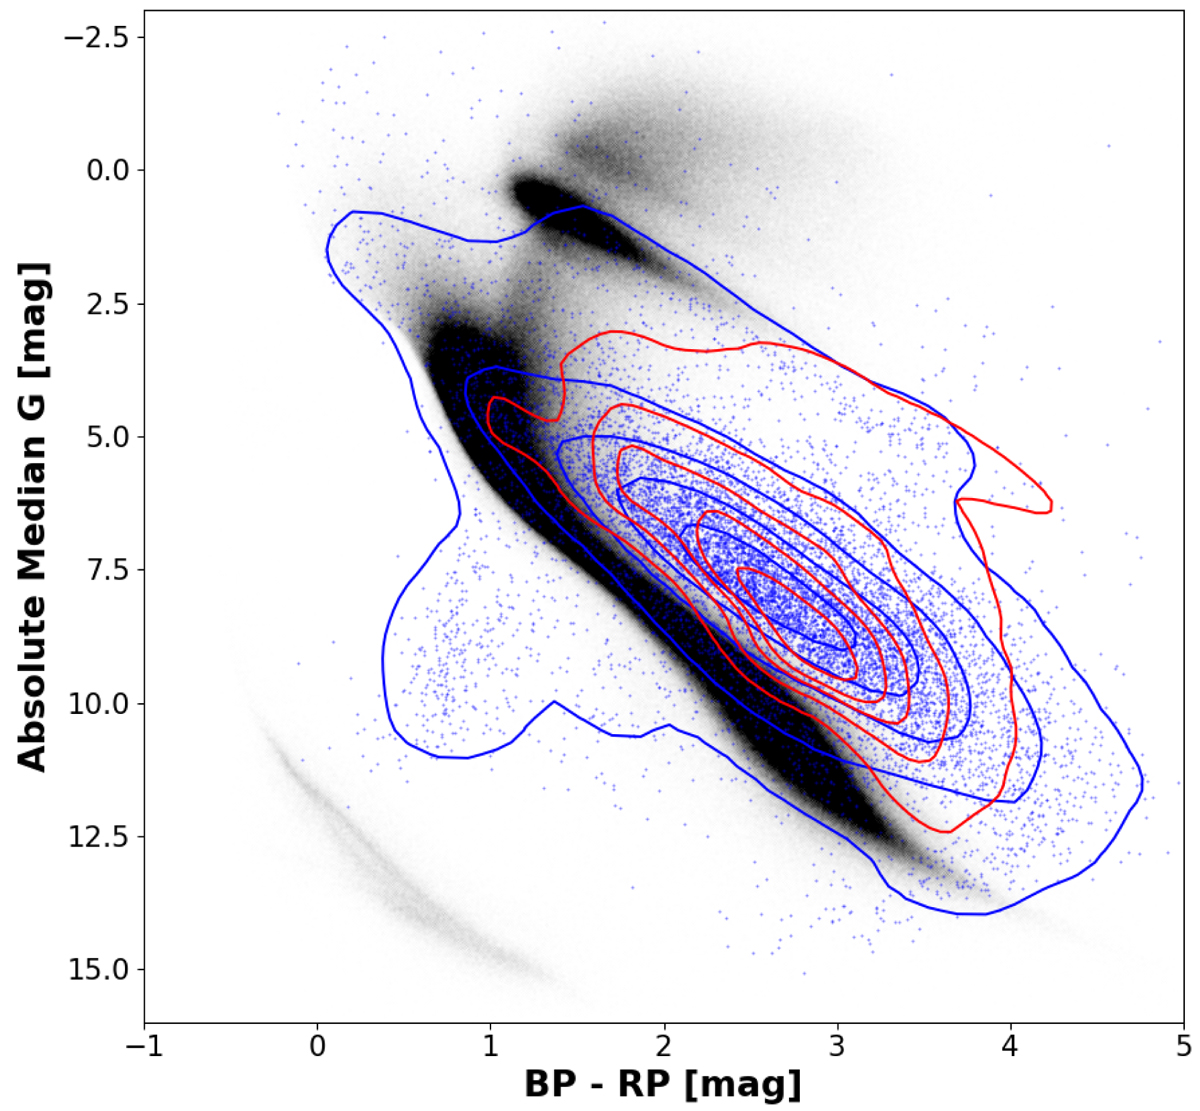
Fig. 4.
Download original image
Observational HRD of Gaia DR3 YSOs (red contours), KYSOs (blue dots and blue contours), and reference sources (grey dots) as described in the caption of Fig. 1. Most of the KYSOs are located above the main sequence, but other parts of the HRD are also covered. The probability distributions of the GBP − GRP colour and the GAbs are shown in Figs. B.1 and B.5. The main parameters of the distributions are listed in Table 1.
Current usage metrics show cumulative count of Article Views (full-text article views including HTML views, PDF and ePub downloads, according to the available data) and Abstracts Views on Vision4Press platform.
Data correspond to usage on the plateform after 2015. The current usage metrics is available 48-96 hours after online publication and is updated daily on week days.
Initial download of the metrics may take a while.