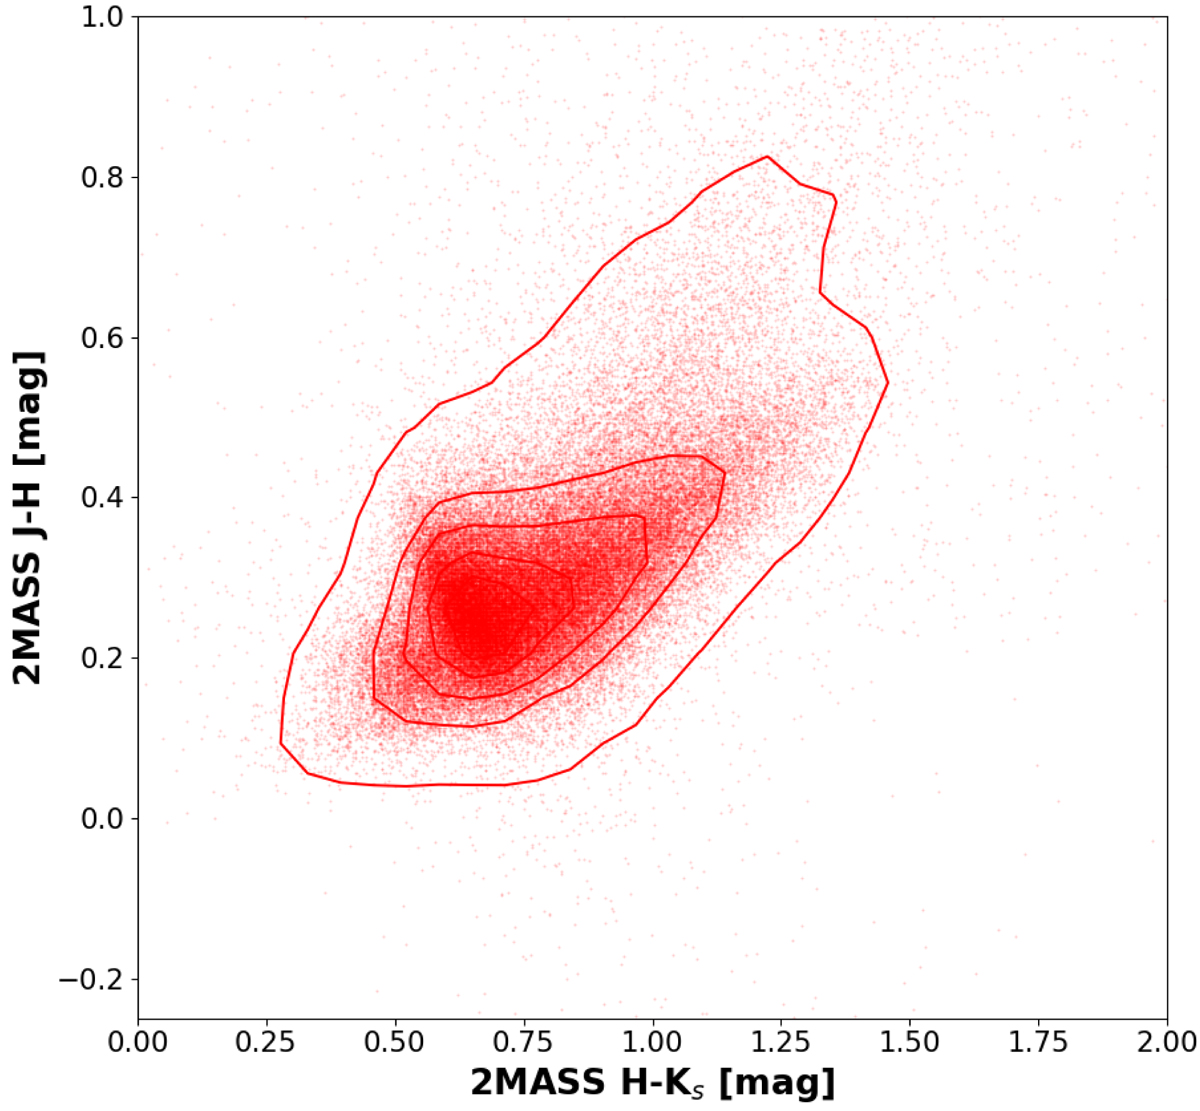
Fig. 2.
Download original image
Gaia DR3 YSOs on the 2MASS colour–colour diagram. The contour levels are at 5%, 25%, 45%, 65%, and 85% of the maximum density value. In the comparison with other catalogues, we use only the red contours of the DR3 distribution for better visibility of the underlying data points. The median, mean, standard deviation, and 5% and 95% quantiles of both colours are listed in Table 1.
Current usage metrics show cumulative count of Article Views (full-text article views including HTML views, PDF and ePub downloads, according to the available data) and Abstracts Views on Vision4Press platform.
Data correspond to usage on the plateform after 2015. The current usage metrics is available 48-96 hours after online publication and is updated daily on week days.
Initial download of the metrics may take a while.