Open Access
Fig. 17.
Download original image
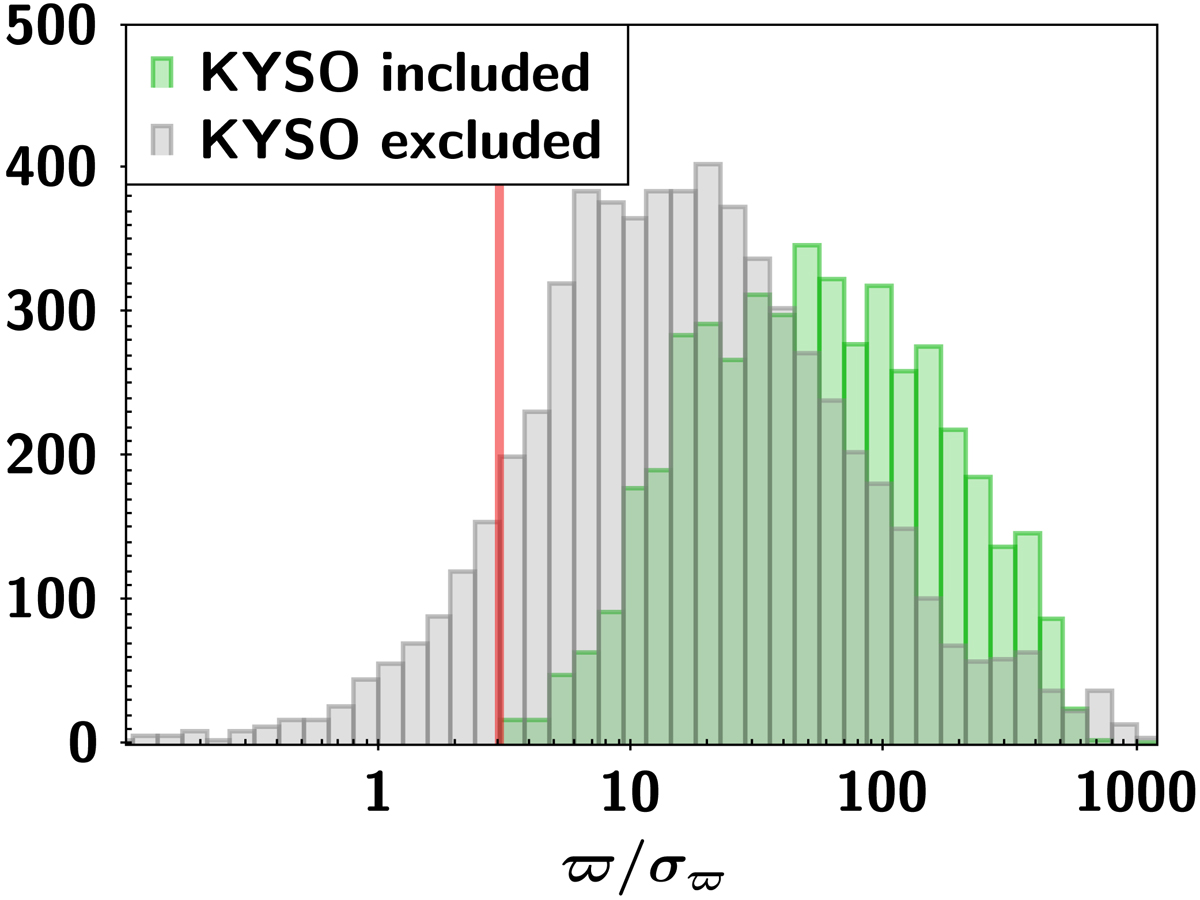
Distribution of parallax over its uncertainty ϖ/σϖ for KYSO sources classified as Gaia DR3 YSOs (green bars) and those KYSOs that were excluded from the final Gaia DR3 YSO candidate list (grey bars). The vertical red line at ϖ/σϖ = 3 indicates the threshold below which we excluded all sources.
Current usage metrics show cumulative count of Article Views (full-text article views including HTML views, PDF and ePub downloads, according to the available data) and Abstracts Views on Vision4Press platform.
Data correspond to usage on the plateform after 2015. The current usage metrics is available 48-96 hours after online publication and is updated daily on week days.
Initial download of the metrics may take a while.