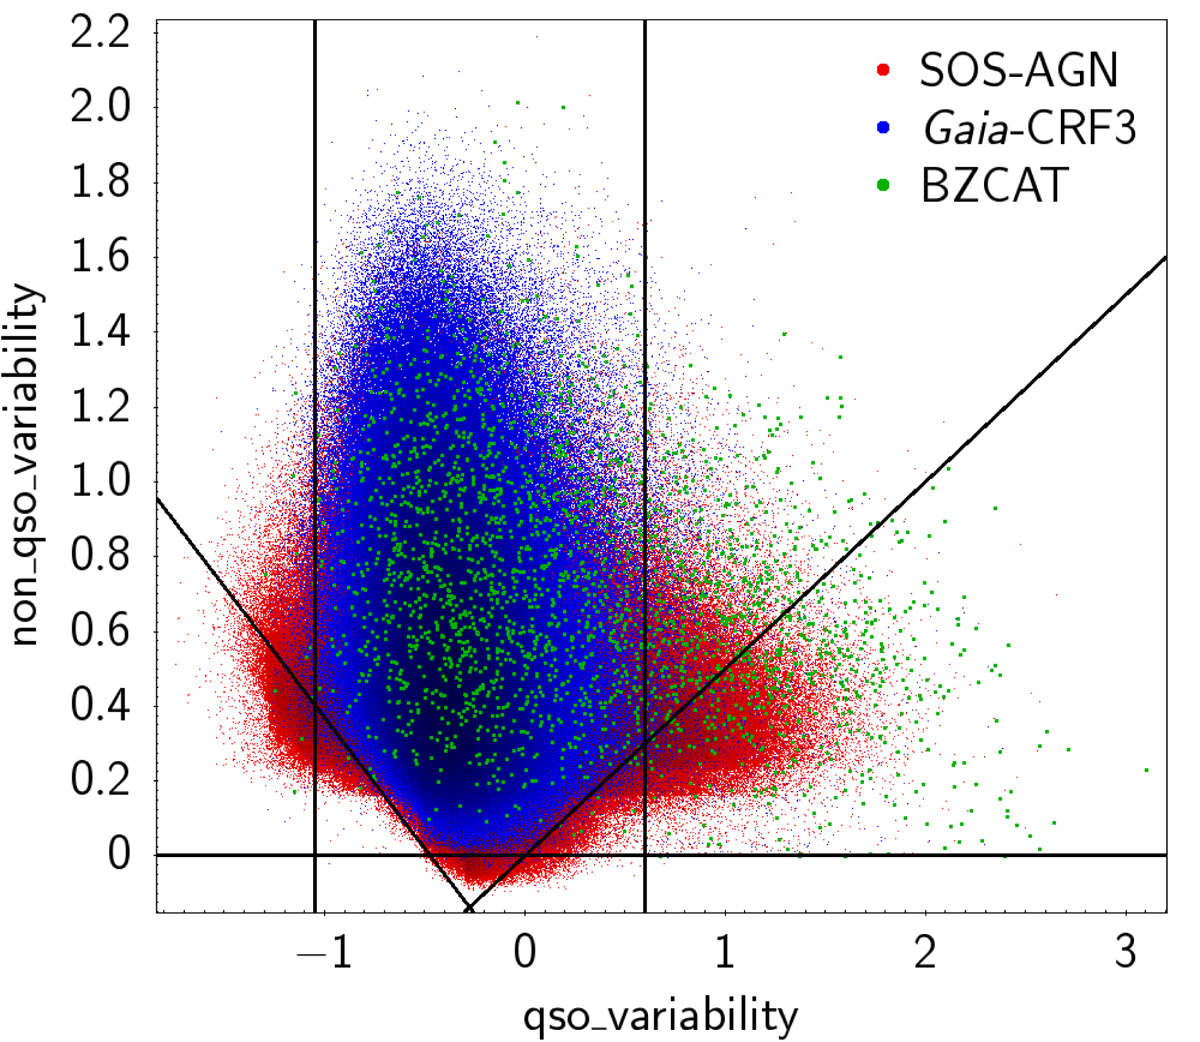
Fig. 7.
Download original image
Butler & Bloom (2011) metrics (or rather their logarithm) non_qso_variability versus qso_variability plot, showing the position of the variable AGN candidates (red dots), distinguishing those in the Gaia-CRF3 sample (blue dots), and the blazars in the BZCAT5 catalogue (green dots). The lines highlight the cuts performed to remove contaminants.
Current usage metrics show cumulative count of Article Views (full-text article views including HTML views, PDF and ePub downloads, according to the available data) and Abstracts Views on Vision4Press platform.
Data correspond to usage on the plateform after 2015. The current usage metrics is available 48-96 hours after online publication and is updated daily on week days.
Initial download of the metrics may take a while.