Fig. 31.
Download original image
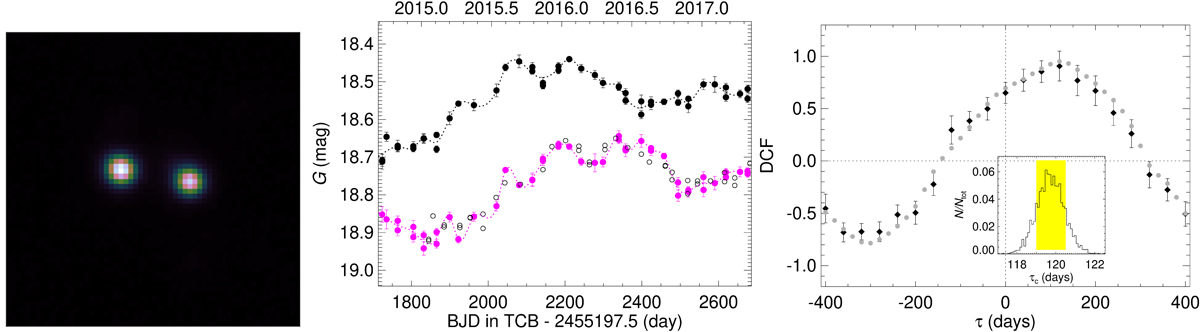
Left: Dark Energy Survey (DES) g-band image of the lens system DESJ0501-4118. Middle: GaiaG-band light curves of image 1 (black dots) and image 2 (magenta dots); the empty circles represent the image 1 light curve shifted in time by 121 days and in brightness by 0.21 mag to match the behaviour of image 2. Dotted lines are cubic spline interpolations through the 30-day binned light curves. Right: DCF between the image 1 and image 2 light curves (black diamonds) and between their splines (grey dots); they indicate a time delay of ∼120 days of the flux variations of image 2 with respect to those of image 1. The inset shows the result of 3000 Monte Carlo DCF simulations; the yellow strip highlights the interval of the time-lag centroid values including 68% of cases (1σ).
Current usage metrics show cumulative count of Article Views (full-text article views including HTML views, PDF and ePub downloads, according to the available data) and Abstracts Views on Vision4Press platform.
Data correspond to usage on the plateform after 2015. The current usage metrics is available 48-96 hours after online publication and is updated daily on week days.
Initial download of the metrics may take a while.