Fig. 3.
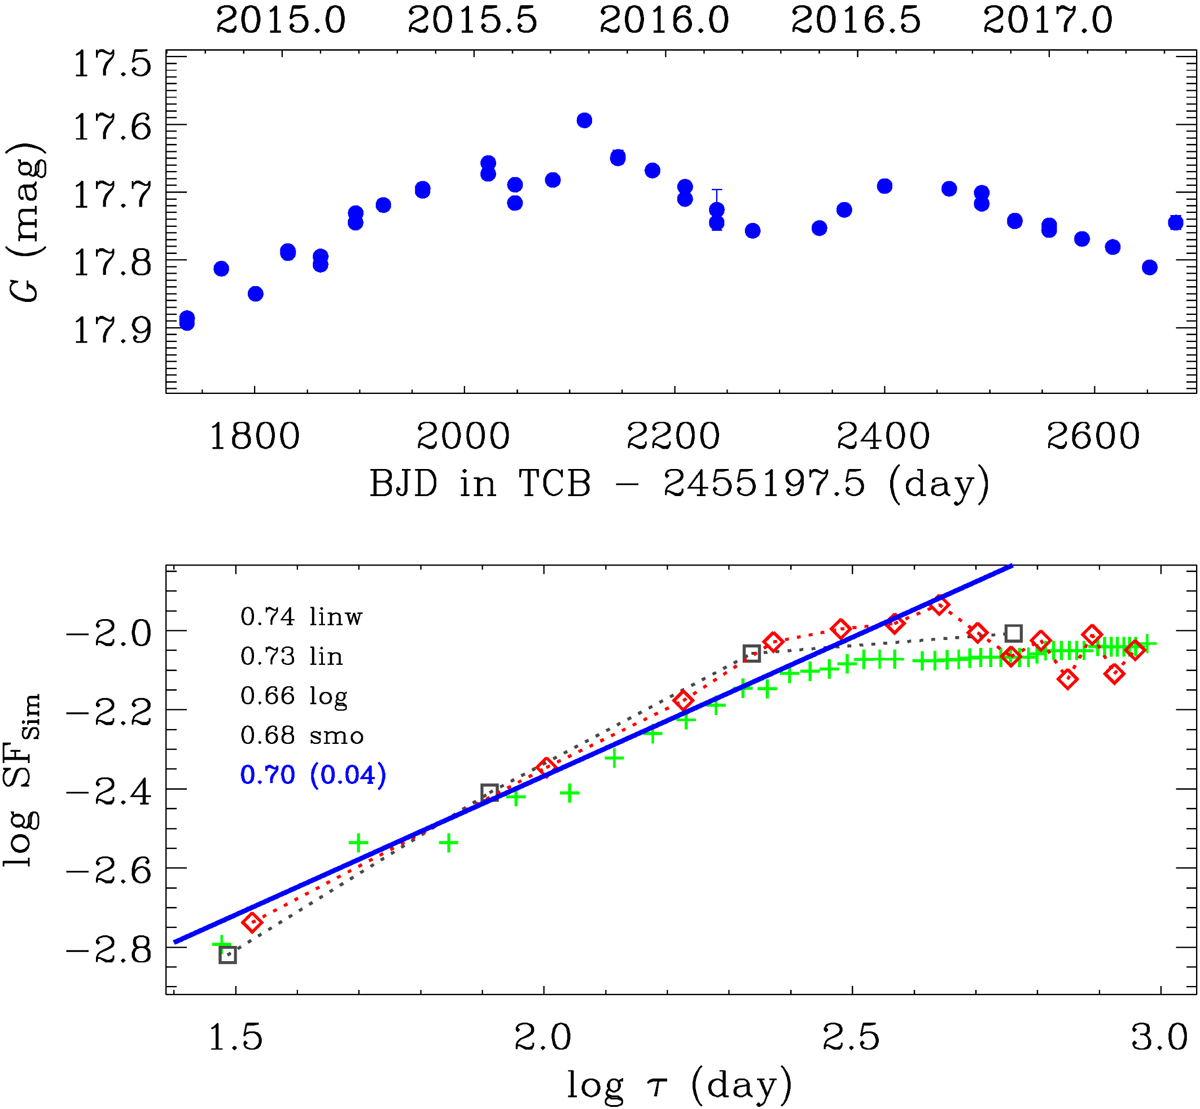
Download original image
Top: G-band light curve of a representative variable AGN (Gaia DR3 source_id=4768409993534612992). Bottom: SF obtained with linear (red diamonds) and logarithmic (grey squares) time-lag sampling, and with the smoothed variogram (green plus signs). The legend lists the SF slopes obtained with the four methods described in the text (black) and the final slope (blue) with its standard deviation in brackets. A line with this slope is drawn in blue.
Current usage metrics show cumulative count of Article Views (full-text article views including HTML views, PDF and ePub downloads, according to the available data) and Abstracts Views on Vision4Press platform.
Data correspond to usage on the plateform after 2015. The current usage metrics is available 48-96 hours after online publication and is updated daily on week days.
Initial download of the metrics may take a while.