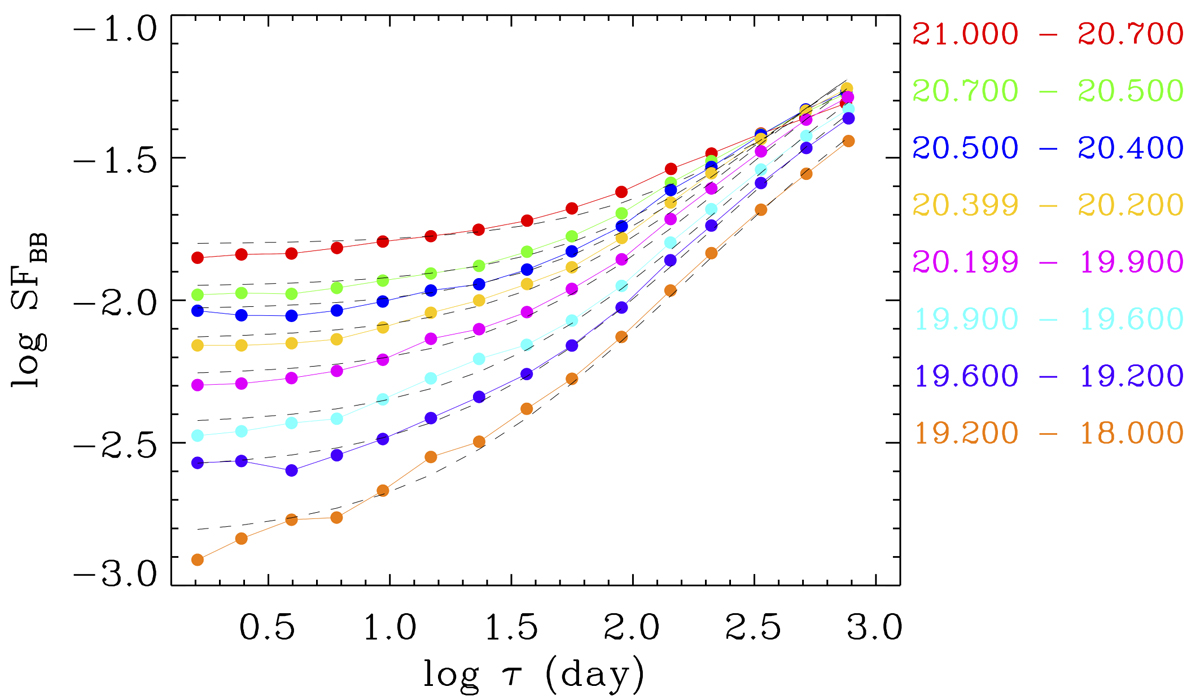
Fig. 2.
Download original image
Mean SF vs. time lag τ for sources with more than five FoV transits in the G band in a preliminary version of the Gaia-CRF3 sample, including about 1 850 000 AGN candidates. The various colours correspond to different G ranges for which the mean SFs have been estimated. Dashed lines represent the best-fit models to the mean SFs according to Eq. (3).
Current usage metrics show cumulative count of Article Views (full-text article views including HTML views, PDF and ePub downloads, according to the available data) and Abstracts Views on Vision4Press platform.
Data correspond to usage on the plateform after 2015. The current usage metrics is available 48-96 hours after online publication and is updated daily on week days.
Initial download of the metrics may take a while.