| Issue |
A&A
Volume 674, June 2023
|
|
|---|---|---|
| Article Number | C1 | |
| Number of page(s) | 3 | |
| Section | Interstellar and circumstellar matter | |
| DOI | https://doi.org/10.1051/0004-6361/202243994e | |
| Published online | 07 June 2023 | |
Dust depletion of metals from local to distant galaxies
I. Peculiar nucleosynthesis effects and grain growth in the ISM (Corrigendum)
1
Department of Astronomy, University of Geneva,
Chemin Pegasi 51,
1290
Versoix, Switzerland
e-mail: christina.konstantopoulou@unige.ch
2
European Southern Observatory,
Karl-Schwarzschild Str. 2,
85748
Garching bei München, Germany
3
Centre de Recherche Astrophysique de Lyon,
Univ. Claude Bernard Lyon 1, 9 Av. Charles Andre,
69230
St Genis Laval, France
4
European Southern Observatory,
Alonso de Córdova 3107, Vitacura, Casilla
19001,
Santiago, Chile
5
Institut d’Astrophysique de Paris, CNRS-SU, UMR 7095,
98bis bd Arago,
75014,
Paris, France
6
Niels Bohr Institute, University of Copenhagen,
Jagtvej 128,
2200
Copenhagen N, Denmark
7
Cosmic Dawn Center (DAWN),
Copenhagen, Denmark
Key words: dust / extinction / galaxies: ISM / galaxies: abundances / Galaxy: abundances / Magellanic Clouds / errata / addenda
In this erratum we remove duplicate entries from Table D.1 of the original paper for QSO-DLAs. Removing the duplicated entries from Table D.1 has no effect on the results of the original paper.
Additionally, we update the P II column densities for the Milky Way that are taken from Jenkins (2009), adopting the most recent value f = 0.0196 for the λ1301 Å line of Brown et al. (2018). This value is based on comprehensive beam-foil measurements. In the original paper, we homogenized the P II column densities to the oscillator strength f= 0.0053 derived by Kurucz (2017), which is an older value. The updated column densities are given in Table 1. The updated and the old A2P and B2P coefficients resulting from the fit are presented in Table 2, where the difference between the old and new values are small and within the uncertainties. Figure 1 shows the updated fit for [P/Zn] with [Zn/Fe] (left) and the dust depletion δP with [Zn/Fe] (right). The updated table for QSO-DLAs without the duplicates is Table 3.
References
- Berg, T. A. M., Ellison, S. L., Prochaska, J. X., Venn, K. A., & Dessauges-Zavadsky, M. 2015, MNRAS, 452, 4326 [NASA ADS] [CrossRef] [Google Scholar]
- Brown, M. S., Alkhayat, R. B., Irving, R. E., et al. 2018, ApJ, 868, 42 [NASA ADS] [CrossRef] [Google Scholar]
- Cashman, F. H., Kulkarni, V. P., Kisielius, R., Ferland, G. J., & Bogdanovich, P. 2017, ApJS, 230, 8 [NASA ADS] [CrossRef] [Google Scholar]
- De Cia, A., Ledoux, C., Mattsson, L., et al. 2016, A&A, 596, A97 [NASA ADS] [CrossRef] [EDP Sciences] [Google Scholar]
- Jenkins, E. B. 2009, ApJ, 700, 1299 [Google Scholar]
- Kisielius, R., Kulkarni, V. P., Ferland, G. J., Bogdanovich, P., & Lykins, M. L. 2014, ApJ, 780, 76 [Google Scholar]
- Kisielius, R., Kulkarni, V. P., Ferland, G. J., et al. 2015, ApJ, 804, 76 [NASA ADS] [CrossRef] [Google Scholar]
- Kurucz, R. L. 2017, Canadian J. Phys., 95, 825 [NASA ADS] [CrossRef] [Google Scholar]
© The Authors 2023
 Open Access article, published by EDP Sciences, under the terms of the Creative Commons Attribution License (https://creativecommons.org/licenses/by/4.0), which permits unrestricted use, distribution, and reproduction in any medium, provided the original work is properly cited.
This article is published in open access under the Subscribe to Open model. Subscribe to A&A to support open access publication.
All Tables
All Figures
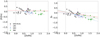 |
Fig. 1 Relative abundance of P with respect to Zn against [Zn/Fe] (left). Dust depletion of P against [Zn/Fe] (right). The linear fits for the QSO-DLAs (black triangles and black line), for the LMC (purple stars and purple line), for the SMC (blue triangles and blue line) and for the Milky Way (green points and green line) are shown. The solid red line shows the linear fit to the merged data, resulting in the new A2P and B2P coefficients given in Table 2. |
| In the text | |
Current usage metrics show cumulative count of Article Views (full-text article views including HTML views, PDF and ePub downloads, according to the available data) and Abstracts Views on Vision4Press platform.
Data correspond to usage on the plateform after 2015. The current usage metrics is available 48-96 hours after online publication and is updated daily on week days.
Initial download of the metrics may take a while.