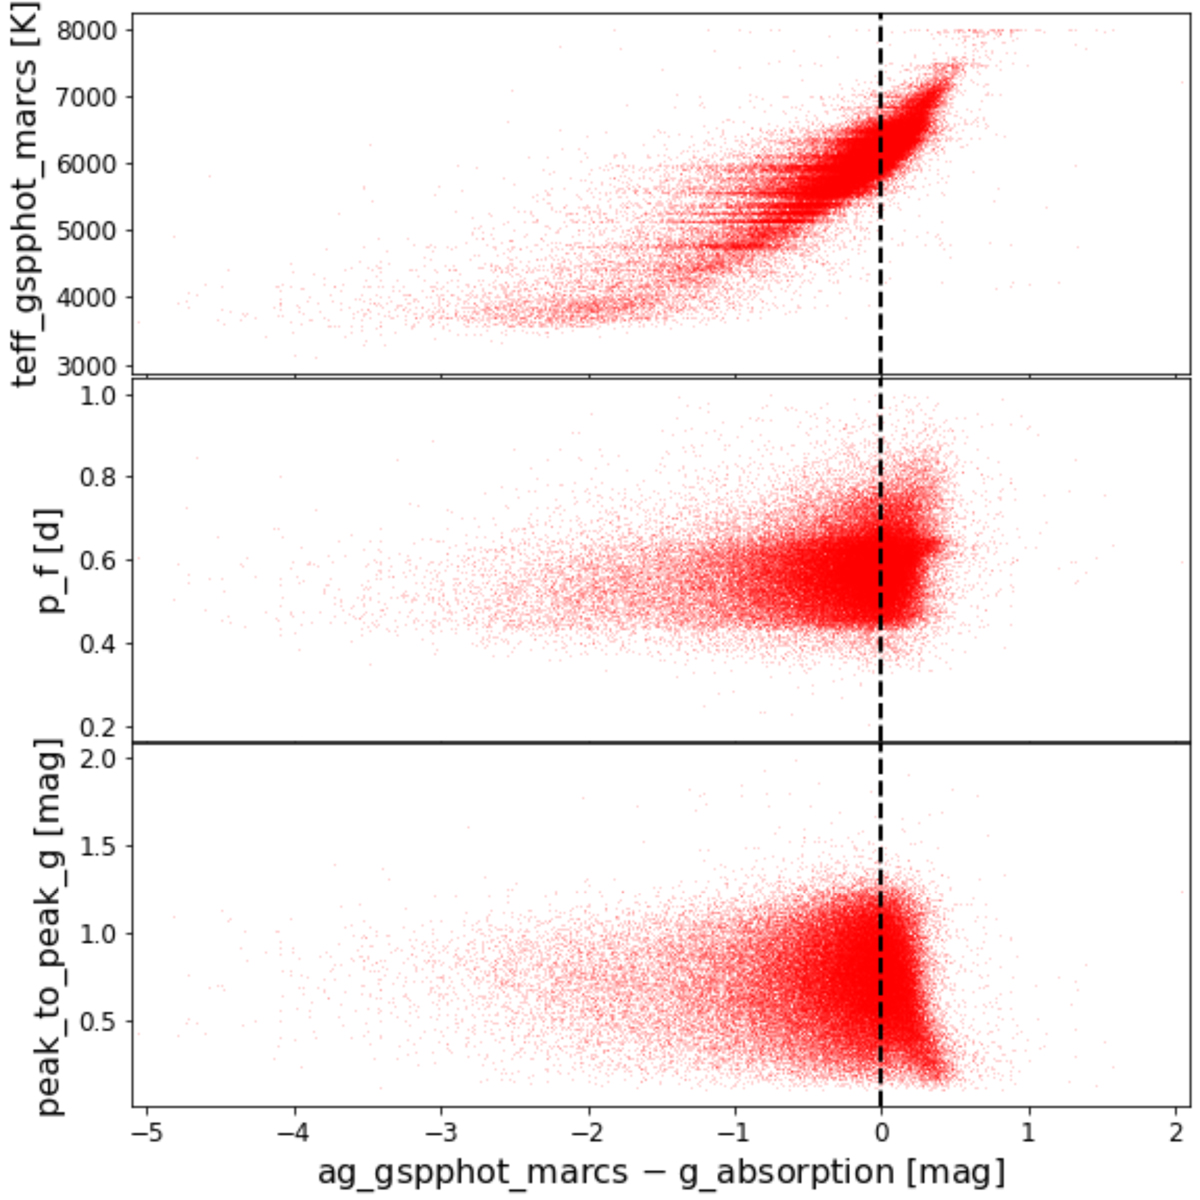
Fig. B.5.
Download original image
Run of the GSP_Phot Teff, pulsation period (Pf), and peak-to-peak amplitude in the G band [Amp(G)] of RR Lyrae stars for which both the GSP_Phot and the SOS Cep&RRL G absorption [A(G)] values are available as a function of the difference between the two absorption estimates, using for GSP_Phot only the MARCS library results in the astrophysical_parameters_supp table of the DR3 archive. The absorption differences are clearly unrelated to the pulsation period or the G peak-to-peak amplitude. The top panel clearly shows that large absorption differences are caused by an incorrect temperature in GSP_Phot MARCS. The absorption estimates agree for 6 300 ≲ Teff ≲ 6 800 K, which is the typical mean temperature range of RRab stars (see also Column 11 in Table A.3). The variability (0.2-1.0 mag peak-to-peak amplitude in the G band) of the RR Lyrae stars is absorbed as increased flux uncertainties in the time-averaged BP/RP spectra. Through the unusually large BP/RP flux uncertainties, the χ2 is flattened, and thus space for degeneracies is opened. In particular, a temperature-extinction degeneracy takes place that would explain the difference between the SOS Cep&RRL and the GSP_Phot absorption estimates for RR Lyrae stars.
Current usage metrics show cumulative count of Article Views (full-text article views including HTML views, PDF and ePub downloads, according to the available data) and Abstracts Views on Vision4Press platform.
Data correspond to usage on the plateform after 2015. The current usage metrics is available 48-96 hours after online publication and is updated daily on week days.
Initial download of the metrics may take a while.