Fig. B.4.
Download original image
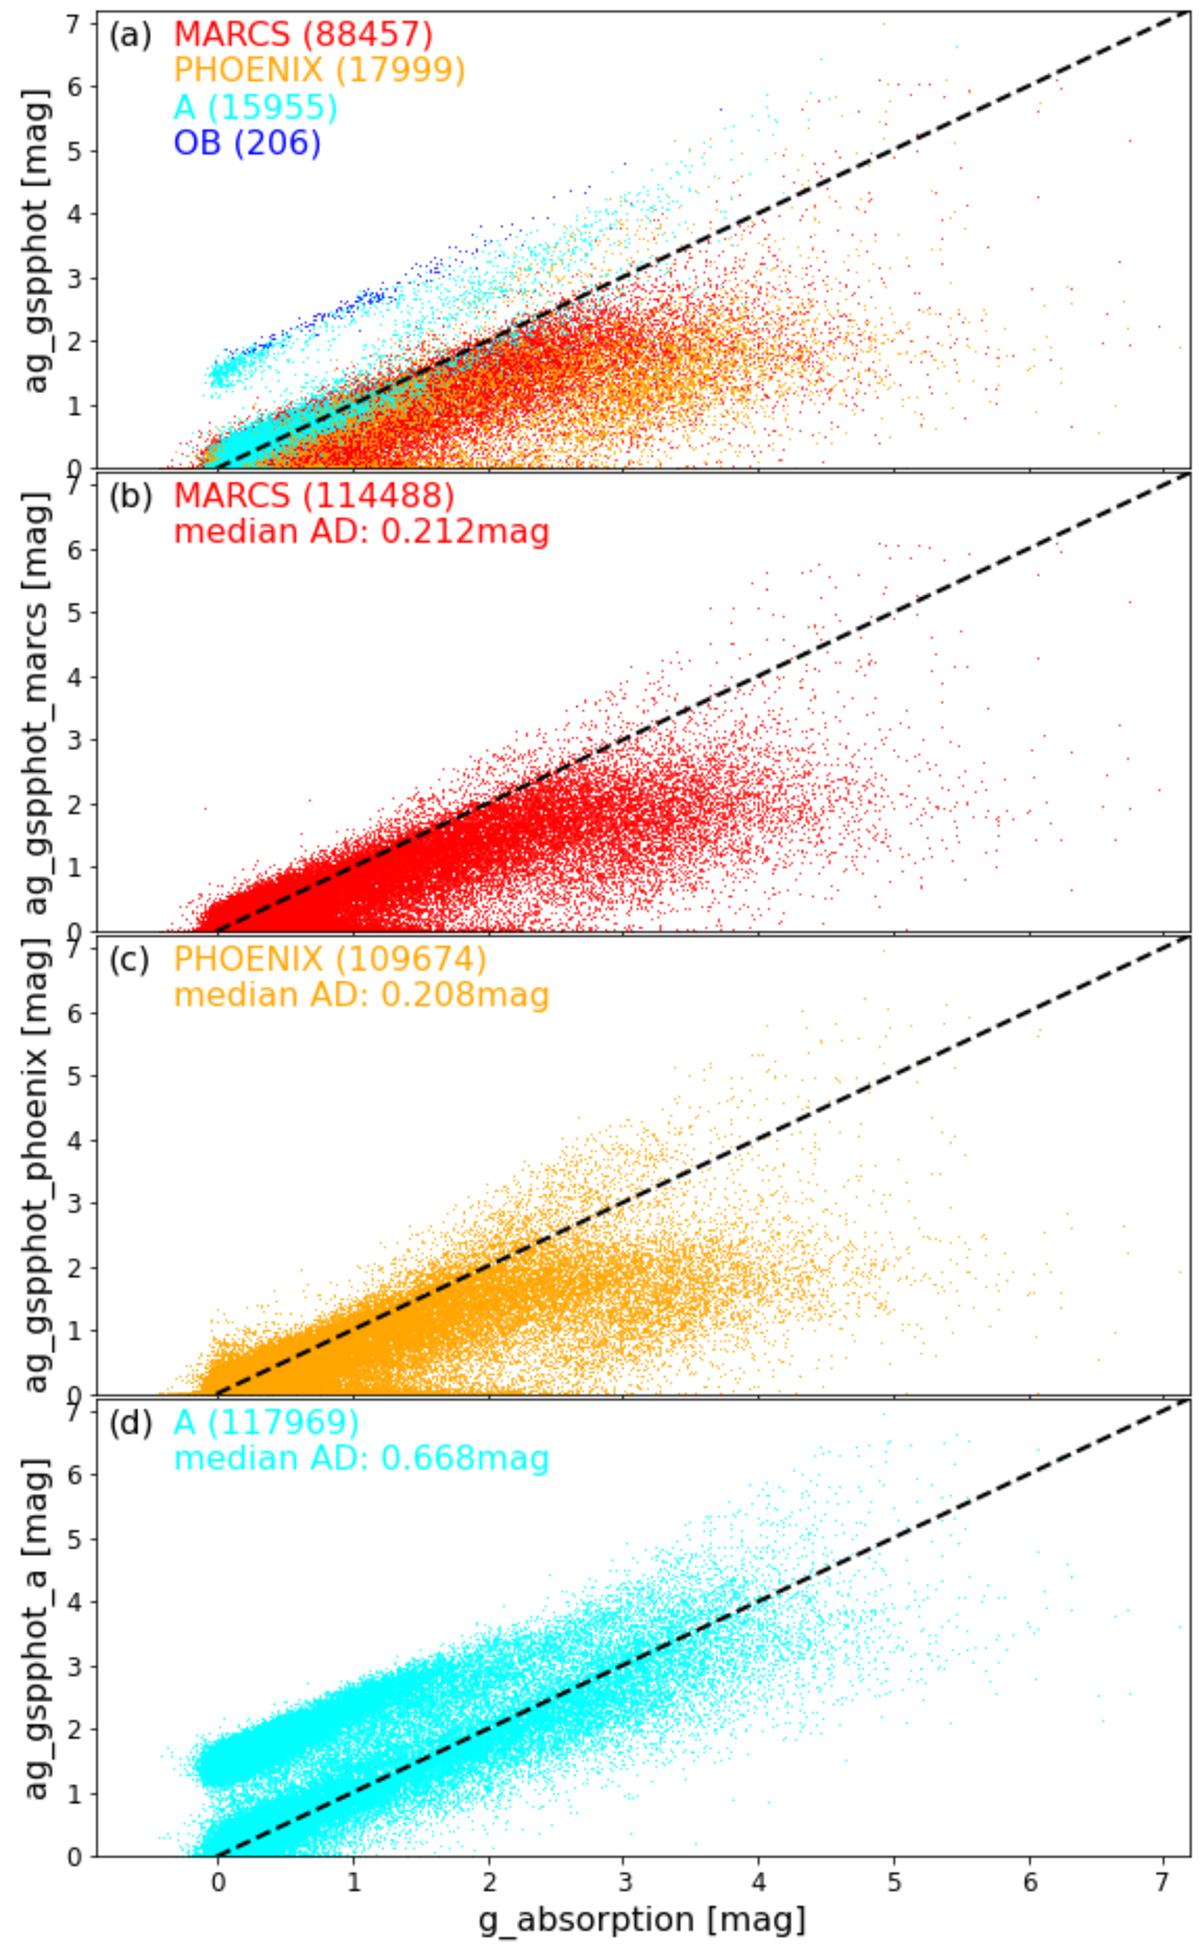
Same as in Fig. 25, but now the sources are colour-coded according to the GSP_Phot best library [Panel (a)]. The numbers next to each library name indicate how often each library is “best”. The outlier group above the one-to-one relation consists of OB stars and some A stars (although other A stars fall nicely onto the 1-1 relation). Panels (b) to (d) show the results from each library individually (not best) as taken from the astrophysical_parameters_supp table in the Gaia archive. Panels (b) and (c) show that the MARCS and PHOENIX libraries do not have the outlier group above the identity relation, but for high SOS Cep&RRL A(G) values, the GSP_Phot absorption appears to be lower. The median absolute differences (AD) are also plotted in panels (b) to (d). They are 0.212 mag for MARCS and 0.208 mag for PHOENIX.
Current usage metrics show cumulative count of Article Views (full-text article views including HTML views, PDF and ePub downloads, according to the available data) and Abstracts Views on Vision4Press platform.
Data correspond to usage on the plateform after 2015. The current usage metrics is available 48-96 hours after online publication and is updated daily on week days.
Initial download of the metrics may take a while.