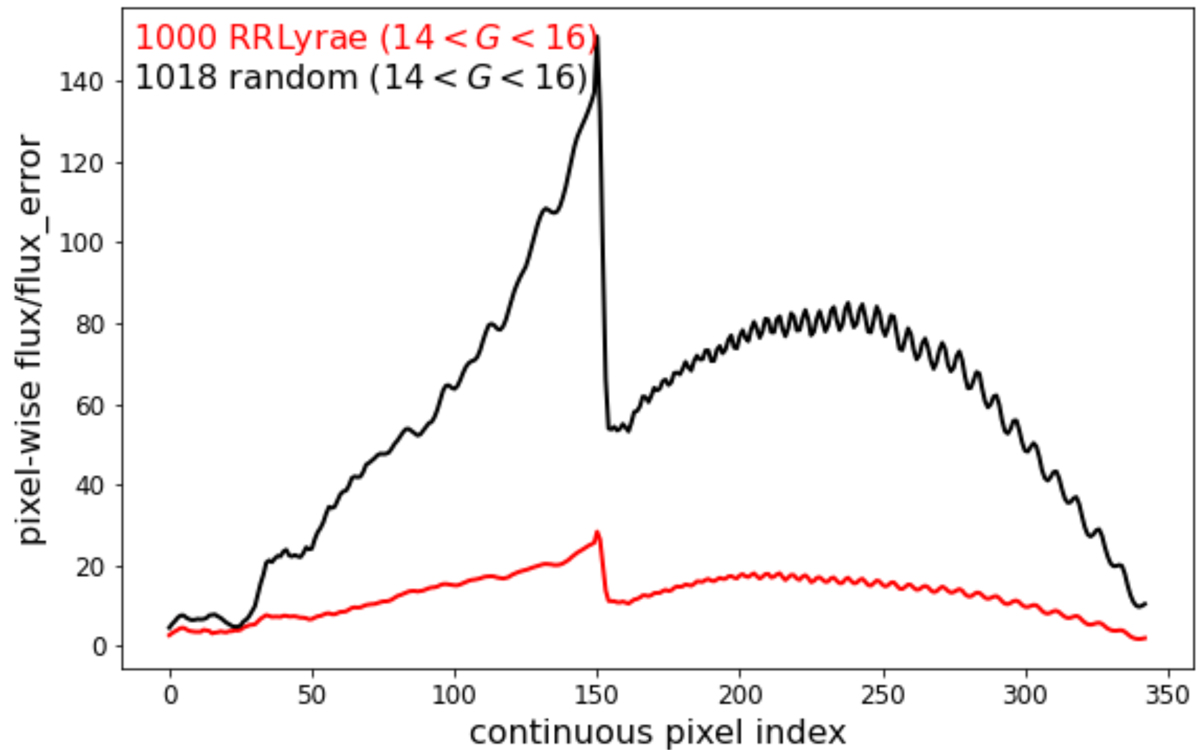
Fig. B.3.
Download original image
Comparison of the S/Ns (median of each sample in each pixel) of the continuous BP/RP spectra of a sample of 1 000 RR Lyrae stars with 14 < ⟨G⟩< 16 mag extracted from the vari_rrlyrae table (red line) and the continuous BP/RP spectra of a control sample composed by 1 000 random non-variable sources with 14 < G < 16 mag. The random sources (black line) have a much higher pixel-wise S/N than the RR Lyrae stars (red line), even though both samples are drawn from the same apparent G range.
Current usage metrics show cumulative count of Article Views (full-text article views including HTML views, PDF and ePub downloads, according to the available data) and Abstracts Views on Vision4Press platform.
Data correspond to usage on the plateform after 2015. The current usage metrics is available 48-96 hours after online publication and is updated daily on week days.
Initial download of the metrics may take a while.