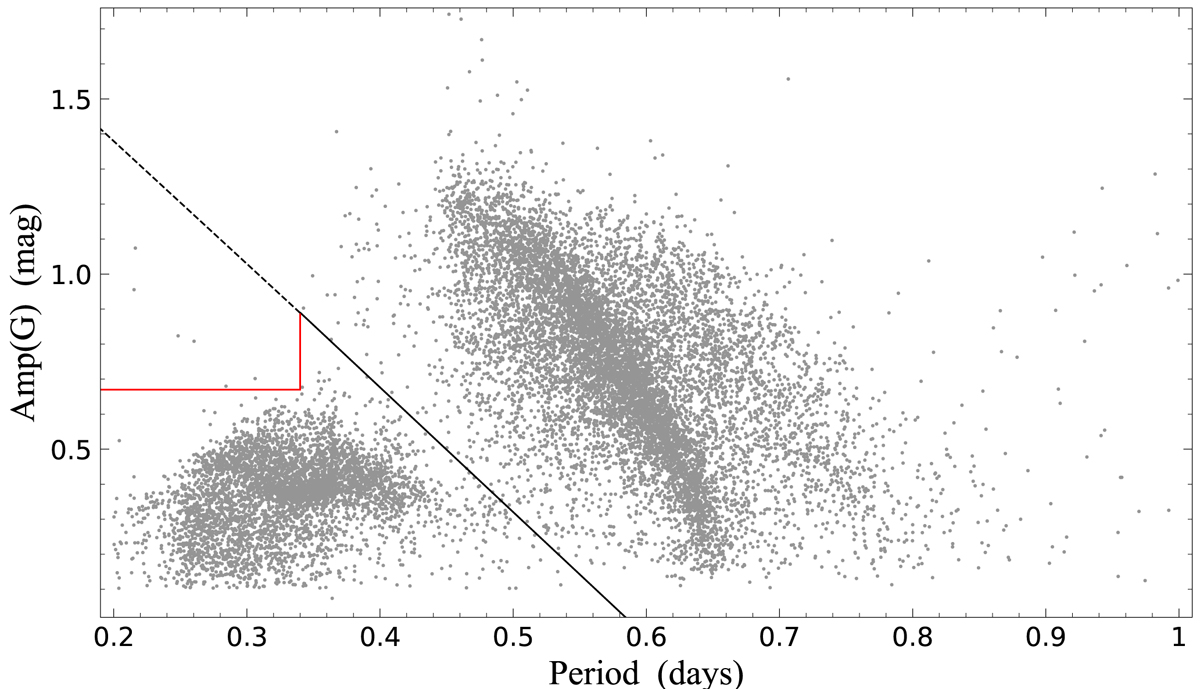
Fig. 3.
Download original image
New boundaries of the RRab and RRc regions in the PA diagram defined by a sample of about 15 000 RR Lyrae stars that was randomly selected from the final RR Lyrae catalogue published in the dr3_vari_rrlyrae table of Gaia DR3. The dotted portion of the black line separating RRab from RRc stars was replaced by the broken red line in order to properly classify high-amplitude RRab stars with pulsation periods in the same domain as RRc stars (see text for details).
Current usage metrics show cumulative count of Article Views (full-text article views including HTML views, PDF and ePub downloads, according to the available data) and Abstracts Views on Vision4Press platform.
Data correspond to usage on the plateform after 2015. The current usage metrics is available 48-96 hours after online publication and is updated daily on week days.
Initial download of the metrics may take a while.