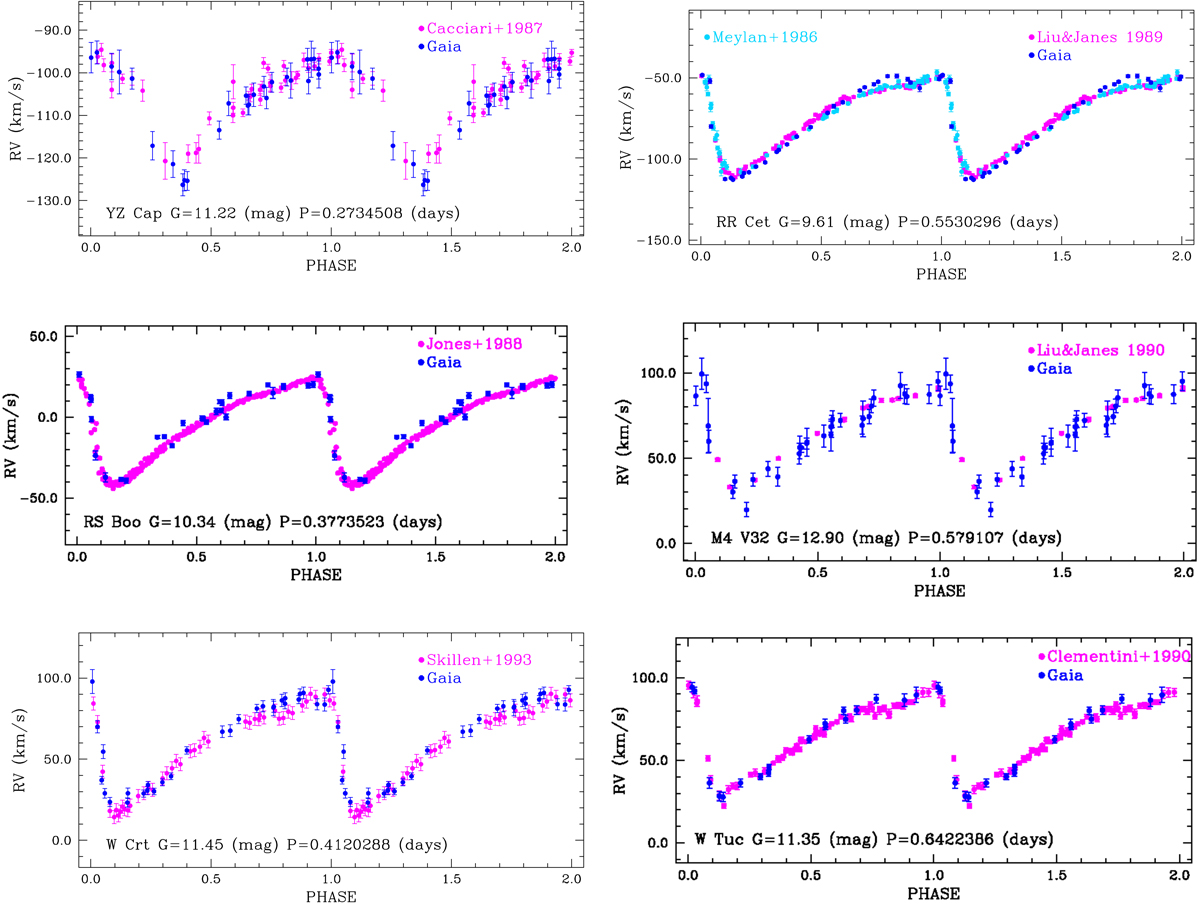
Fig. 18.
Download original image
Comparison of the Gaia RVS radial velocities (filled blue circles) with literature RV datasets (filled magenta and cyan circles) for the RRc star YZ Cap (top left) and the RRab stars RS Boo (middle left), W Crt (bottom left), RR Cet (top right), V32 in the GC M4 (middle right), and W Tuc (bottom right). We also show the pulsation period (as rederived in our analysis) and the intensity-averaged G-band mean magnitude (as derived by the SOS Cep&RRL pipeline). The Gaia RV curve of V32 in M4 was shifted by −5 km s−1 to better match the literature RV curve.
Current usage metrics show cumulative count of Article Views (full-text article views including HTML views, PDF and ePub downloads, according to the available data) and Abstracts Views on Vision4Press platform.
Data correspond to usage on the plateform after 2015. The current usage metrics is available 48-96 hours after online publication and is updated daily on week days.
Initial download of the metrics may take a while.