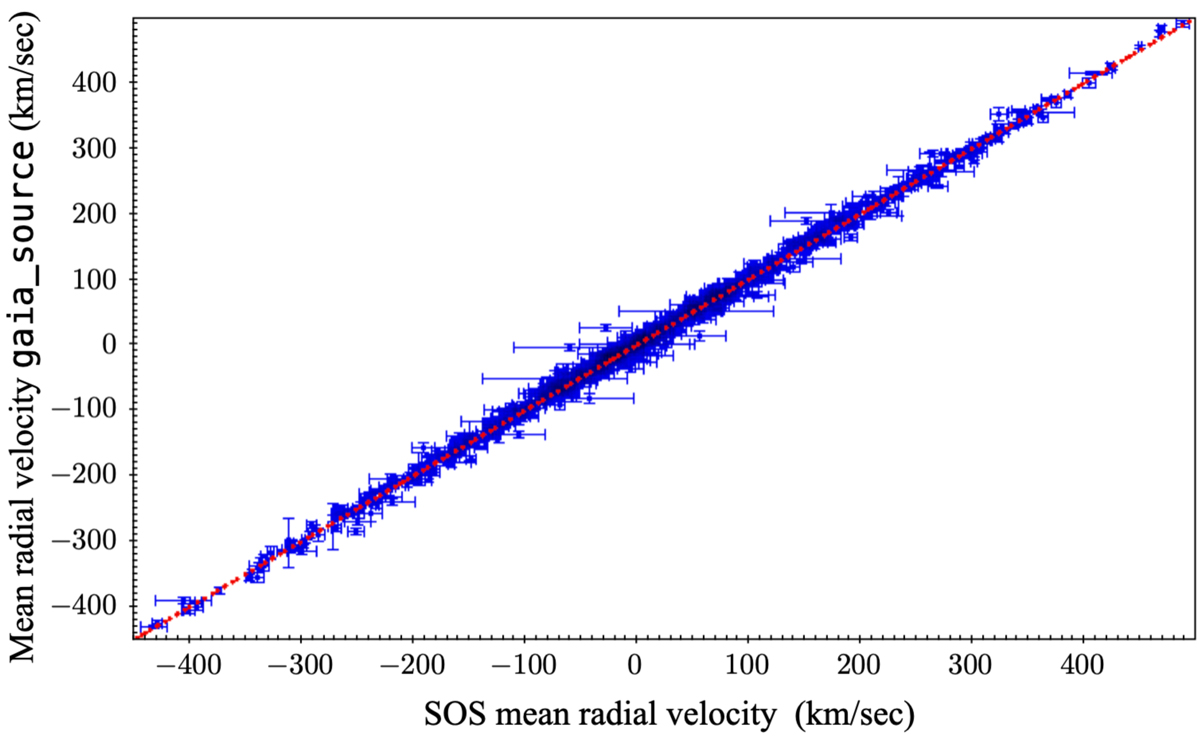
Fig. 16.
Download original image
Comparison of the mean RV values in the DR3 vari_rrlyrae table, which are computed with the SOS Cep&RRL pipeline from the modelled RV curves of the RR Lyrae stars, and the combined RV values in the DR3 gaia_source table for the 1054 RR Lyrae stars for which both values are available. The median and mean difference between the two average values is 5.21 and 6.88 km s−1 (with a standard deviation of 6.35 km s−1), respectively.
Current usage metrics show cumulative count of Article Views (full-text article views including HTML views, PDF and ePub downloads, according to the available data) and Abstracts Views on Vision4Press platform.
Data correspond to usage on the plateform after 2015. The current usage metrics is available 48-96 hours after online publication and is updated daily on week days.
Initial download of the metrics may take a while.