Open Access
Fig. 1.
Download original image
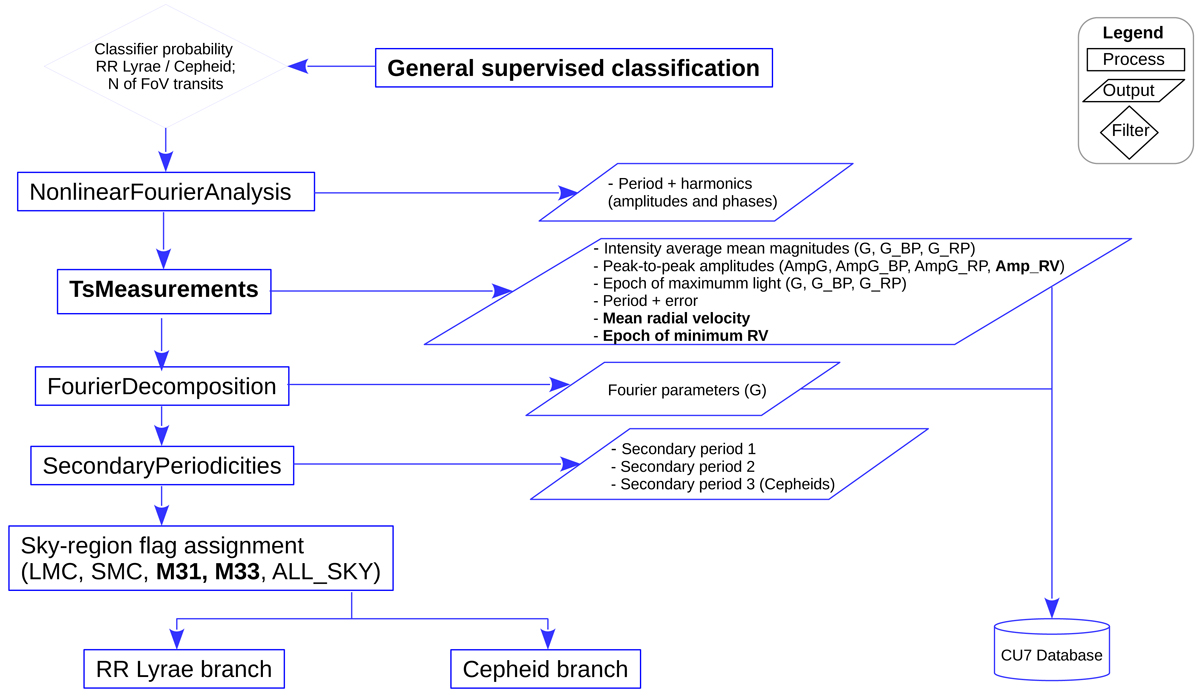
Schematic view of modules (rectangles) and outputs (parallelograms) of the SOS Cep&RRL pipeline main trunk. The figure is an updated version of Fig. 1 in Paper II. Changes and additions to the pipeline version used in DR2 are highlighted in boldface (see text for details).
Current usage metrics show cumulative count of Article Views (full-text article views including HTML views, PDF and ePub downloads, according to the available data) and Abstracts Views on Vision4Press platform.
Data correspond to usage on the plateform after 2015. The current usage metrics is available 48-96 hours after online publication and is updated daily on week days.
Initial download of the metrics may take a while.