Open Access
Fig. 6.
Download original image
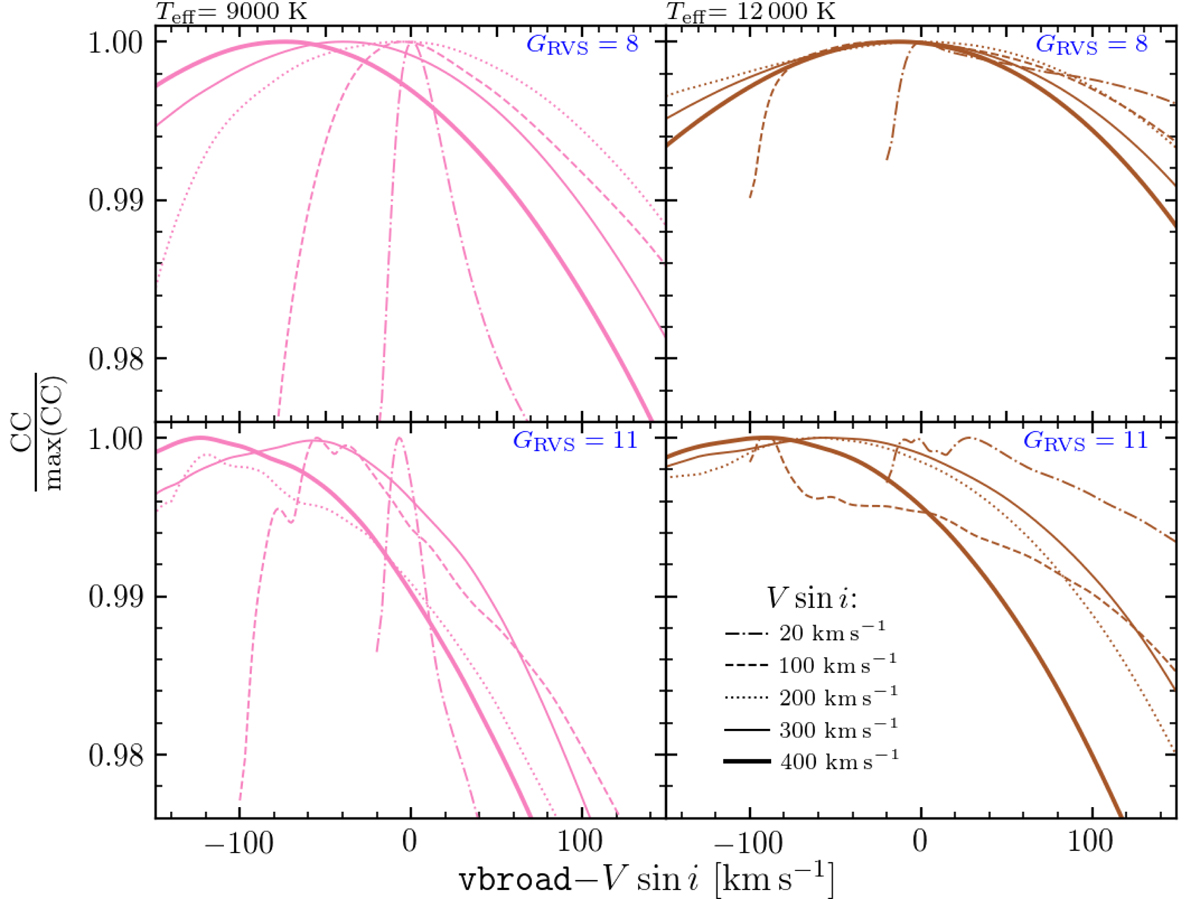
Example of the variation in CCF maximum with Teff, GRVS (noted in blue in the upper right corner of each panel), vbroad, and V sin i (see line styles in the legend). Each curve represents only one noise realisation (i.e. one transit) and is normalised to its highest value at a given V sin i. See also Fig. 1.
Current usage metrics show cumulative count of Article Views (full-text article views including HTML views, PDF and ePub downloads, according to the available data) and Abstracts Views on Vision4Press platform.
Data correspond to usage on the plateform after 2015. The current usage metrics is available 48-96 hours after online publication and is updated daily on week days.
Initial download of the metrics may take a while.