Open Access
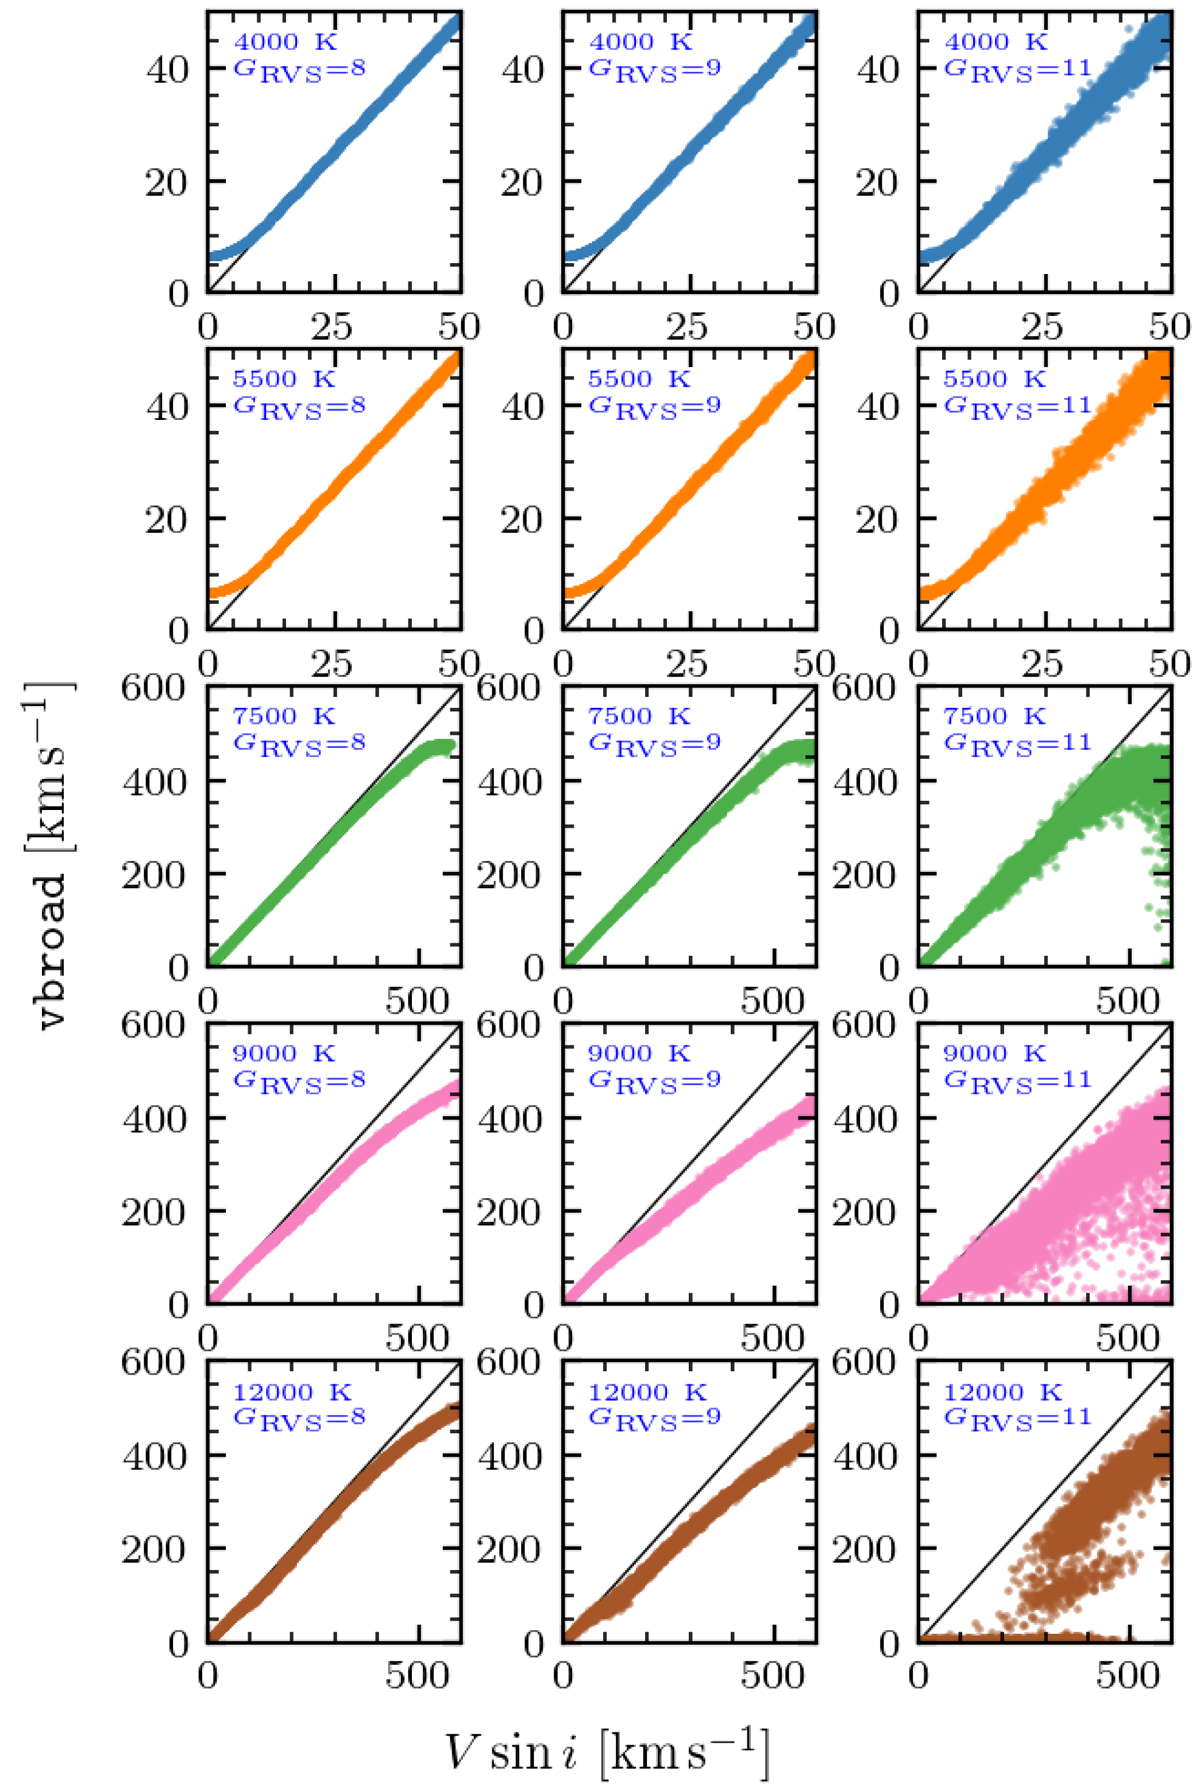
Fig. 4.
Download original image
Monte Carlo simulations: vbroad as a function of V sin i for various GRVS magnitudes and effective temperatures. The identity relation is represented by the black line. The colour -coding is the same as in Fig. 5.
Current usage metrics show cumulative count of Article Views (full-text article views including HTML views, PDF and ePub downloads, according to the available data) and Abstracts Views on Vision4Press platform.
Data correspond to usage on the plateform after 2015. The current usage metrics is available 48-96 hours after online publication and is updated daily on week days.
Initial download of the metrics may take a while.