Fig. B.1.
Download original image
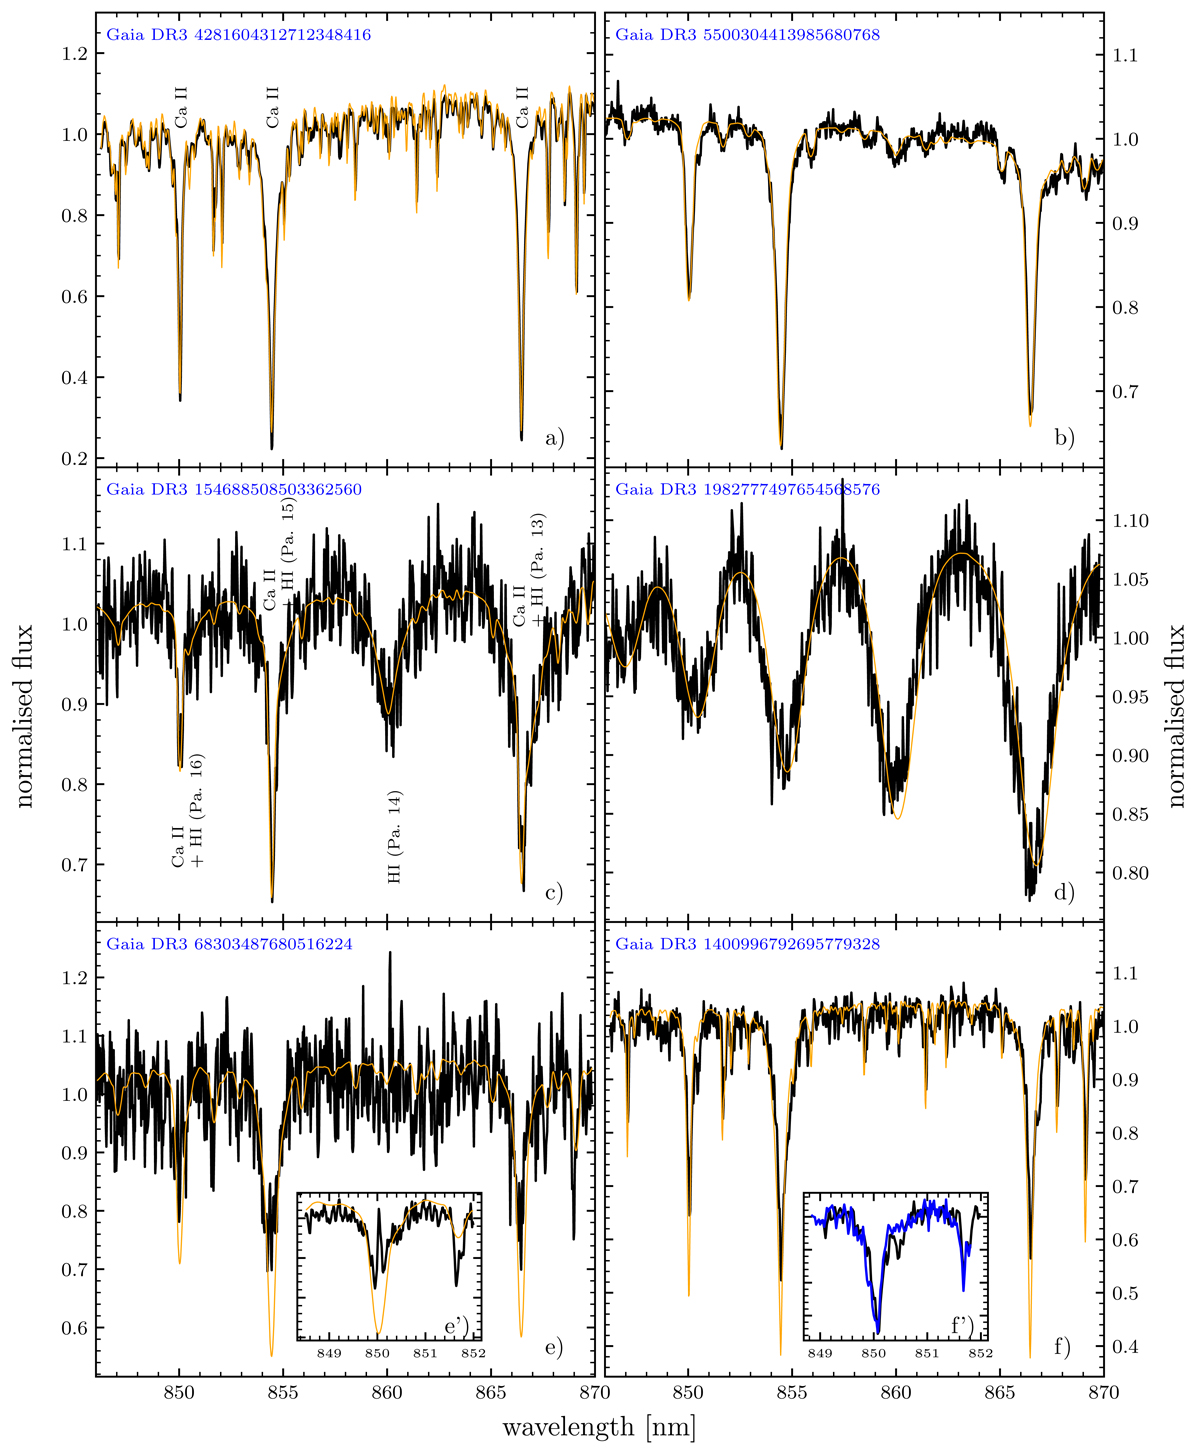
Examples of RVS spectra used to derive the vbroad parameter. Transit spectra (black curve) are compared to the template spectrum used to measure vbroad (orange curve) and broadened to the published estimate. The inset of panel e) zooms in on the corresponding multiple transit combined spectrum (i.e. black curve in subpanel e’) to show the signature of chromospheric activity. The inset of panel f) compares two transit spectra (black and blue) of the same target. The target IDs are given in blue in the upper left corner of the panels, and the GRVS magnitude and astrophysical parameters considered to select and broaden the template spectra (orange) are given in Table B.1. The spectra we used to make these plots are not part of the Gaia DR3 release.
Current usage metrics show cumulative count of Article Views (full-text article views including HTML views, PDF and ePub downloads, according to the available data) and Abstracts Views on Vision4Press platform.
Data correspond to usage on the plateform after 2015. The current usage metrics is available 48-96 hours after online publication and is updated daily on week days.
Initial download of the metrics may take a while.