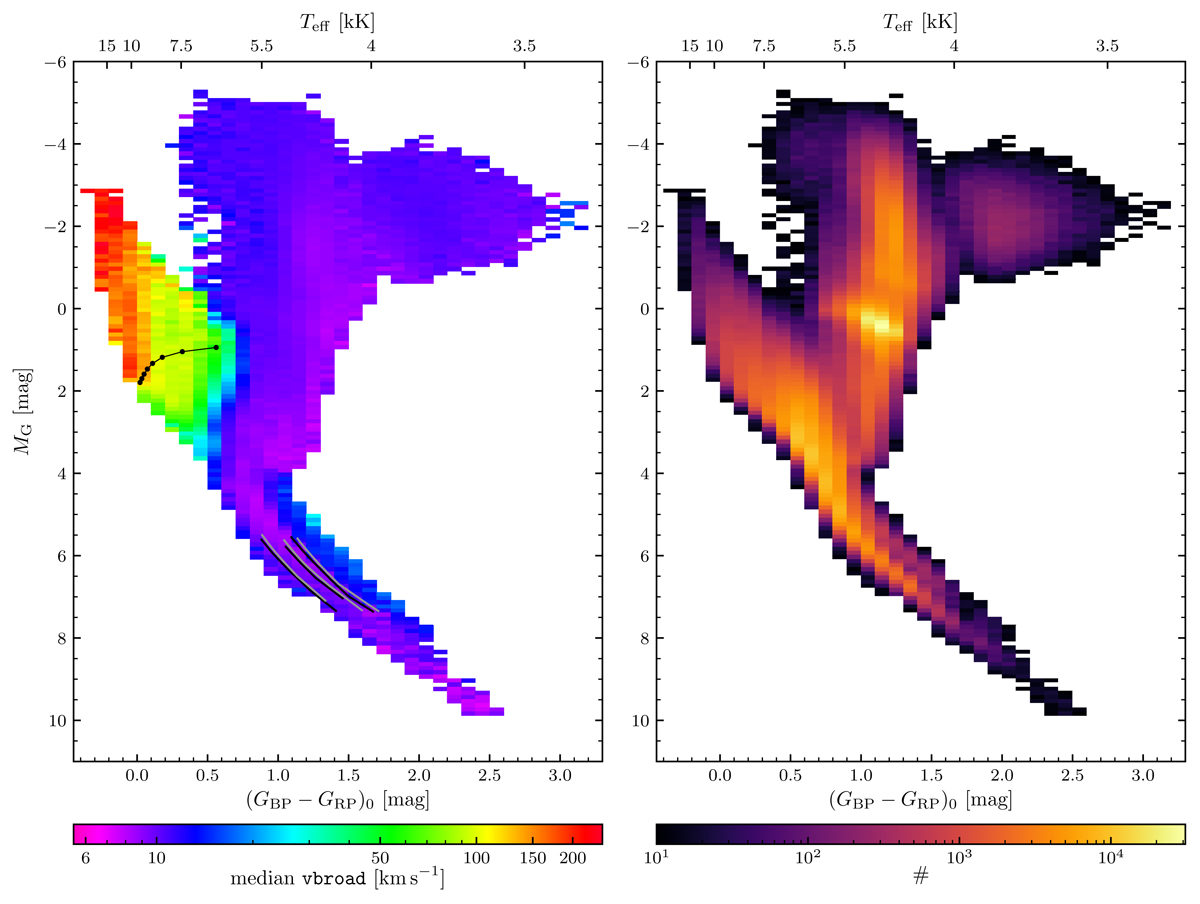
Fig. 16.
Download original image
Hertzsprung-Russell diagrams for a subsample of the Gaia DR3 vbroad catalogue (∼1.8 million stars). The larger part of missing data is due to the lack of extinction parameters to correct for MG and deredden GBP − GRP, which holds for about 43% of the sample. An additional cut is performed on the parallax quality (ϖ/σϖ > 10) and removes 3.2% of the total sample. For hot stars, a selection is made on GRVS, which removes an additional 2.5% of the sample (see text). The binning size is 0.1 by 0.1 mag. Bins containing fewer than ten stars are discarded. Left panel: maps the median vbroad values (in logarithmic colour scale), and the right panel shows the density, in order to better associate the rotational velocity map to the corresponding structures in the HRD. To guide the eye, the upper x-axes show the approximate Teff scale, calibrated as a function of GBP − GRP using the photometric temperatures. The evolutionary track of a 2 M⊙ star in the left panel, sampled each 162.5 Myr, illustrates the course from the ZAMS to the TAMS in the upper MS. In addition, three pairs of isochrones are superimposed on the lower MS for two different ages (1 Gyr in black and 10 Gyr in grey) and three different metallicities: [M/H] = −0.5, 0, and + 0.5, from left to right.
Current usage metrics show cumulative count of Article Views (full-text article views including HTML views, PDF and ePub downloads, according to the available data) and Abstracts Views on Vision4Press platform.
Data correspond to usage on the plateform after 2015. The current usage metrics is available 48-96 hours after online publication and is updated daily on week days.
Initial download of the metrics may take a while.