Fig. 15.
Download original image
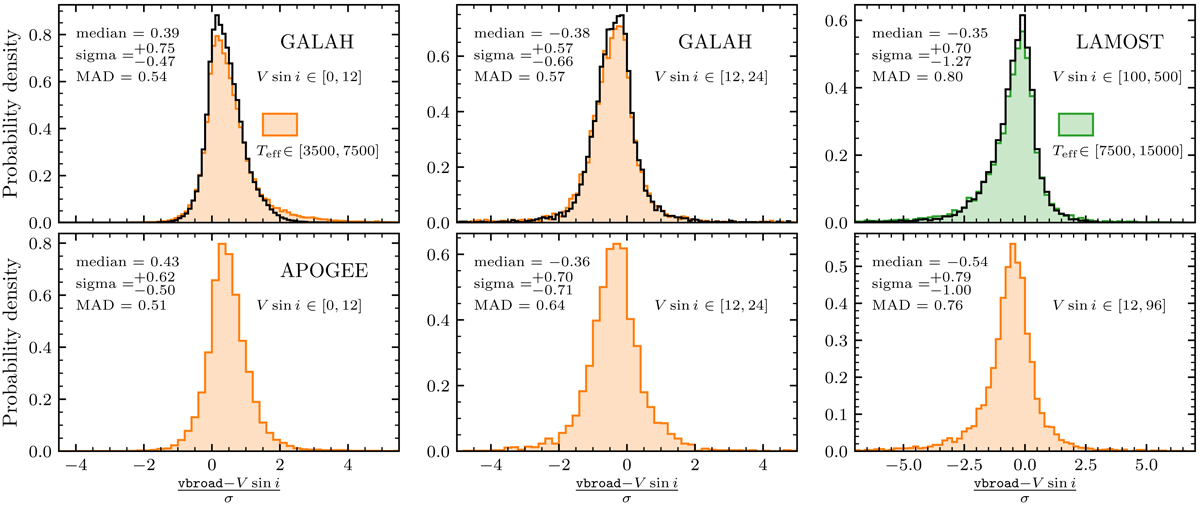
Distribution of the residuals for different catalogues: GALAH and LAMOST (top row), and APOGEE (bottom row). Residuals are normalised by the uncertainty on vbroad in the Gaia DR3 catalogue. For the top panels, the superimposed black curve is the residual distribution normalised by the total uncertainty ![]() . Each row corresponds to a selection in Teff and V sin i. Statistical estimators are given for each panel: Median value, upper and lower dispersions (85% quantile – median, and median – 15% quantile), and mean absolute deviation.
. Each row corresponds to a selection in Teff and V sin i. Statistical estimators are given for each panel: Median value, upper and lower dispersions (85% quantile – median, and median – 15% quantile), and mean absolute deviation.
Current usage metrics show cumulative count of Article Views (full-text article views including HTML views, PDF and ePub downloads, according to the available data) and Abstracts Views on Vision4Press platform.
Data correspond to usage on the plateform after 2015. The current usage metrics is available 48-96 hours after online publication and is updated daily on week days.
Initial download of the metrics may take a while.