Fig. 13.
Download original image
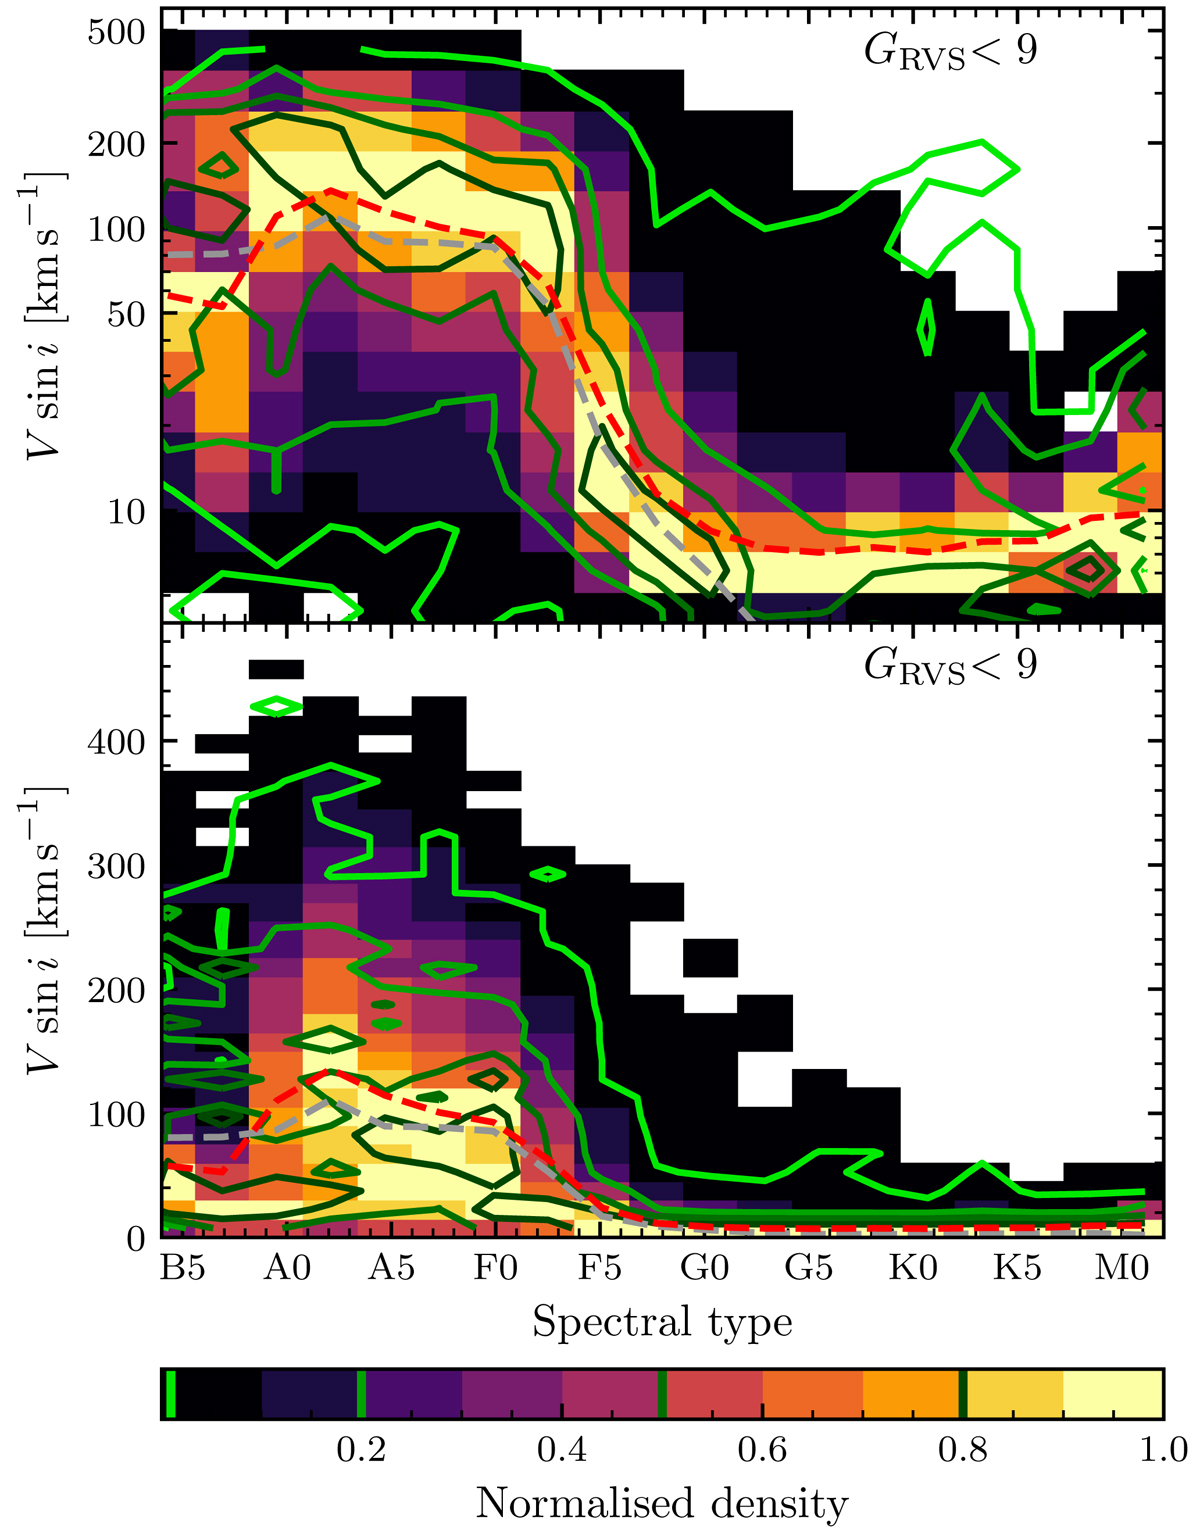
Comparison of the distribution of vbroad as a function of spectral type (2D histogram, coloured by the linear number of targets), with the distribution of V sin i from GG (green contour lines). Top panel: the distribution with regular bins in logarithmic velocity scale, and the bottom panel displays the resulting distribution using a linear grid in velocity. The vbroad data are selected to be brighter than GRVS = 9 and to be on the MS (3.5 ≤ log g ≤ 4.5). V sin i data from GG are selected in the GG comparison sample (Table 2) with the same log g criterion. Spectral types are estimated on the basis of rv_template_teff by interpolating in the tables provided by Cox (2000). Dashed lines are the median values per bin of spectral types for the vbroad distribution (red) and the V sin i (grey). For each spectral type bin, the distribution is normalised to its maximum value. The colour bar superimposes the scale of the 2D histogram with the contour levels (0.01, 0.2, 0.5, and 0.8).
Current usage metrics show cumulative count of Article Views (full-text article views including HTML views, PDF and ePub downloads, according to the available data) and Abstracts Views on Vision4Press platform.
Data correspond to usage on the plateform after 2015. The current usage metrics is available 48-96 hours after online publication and is updated daily on week days.
Initial download of the metrics may take a while.