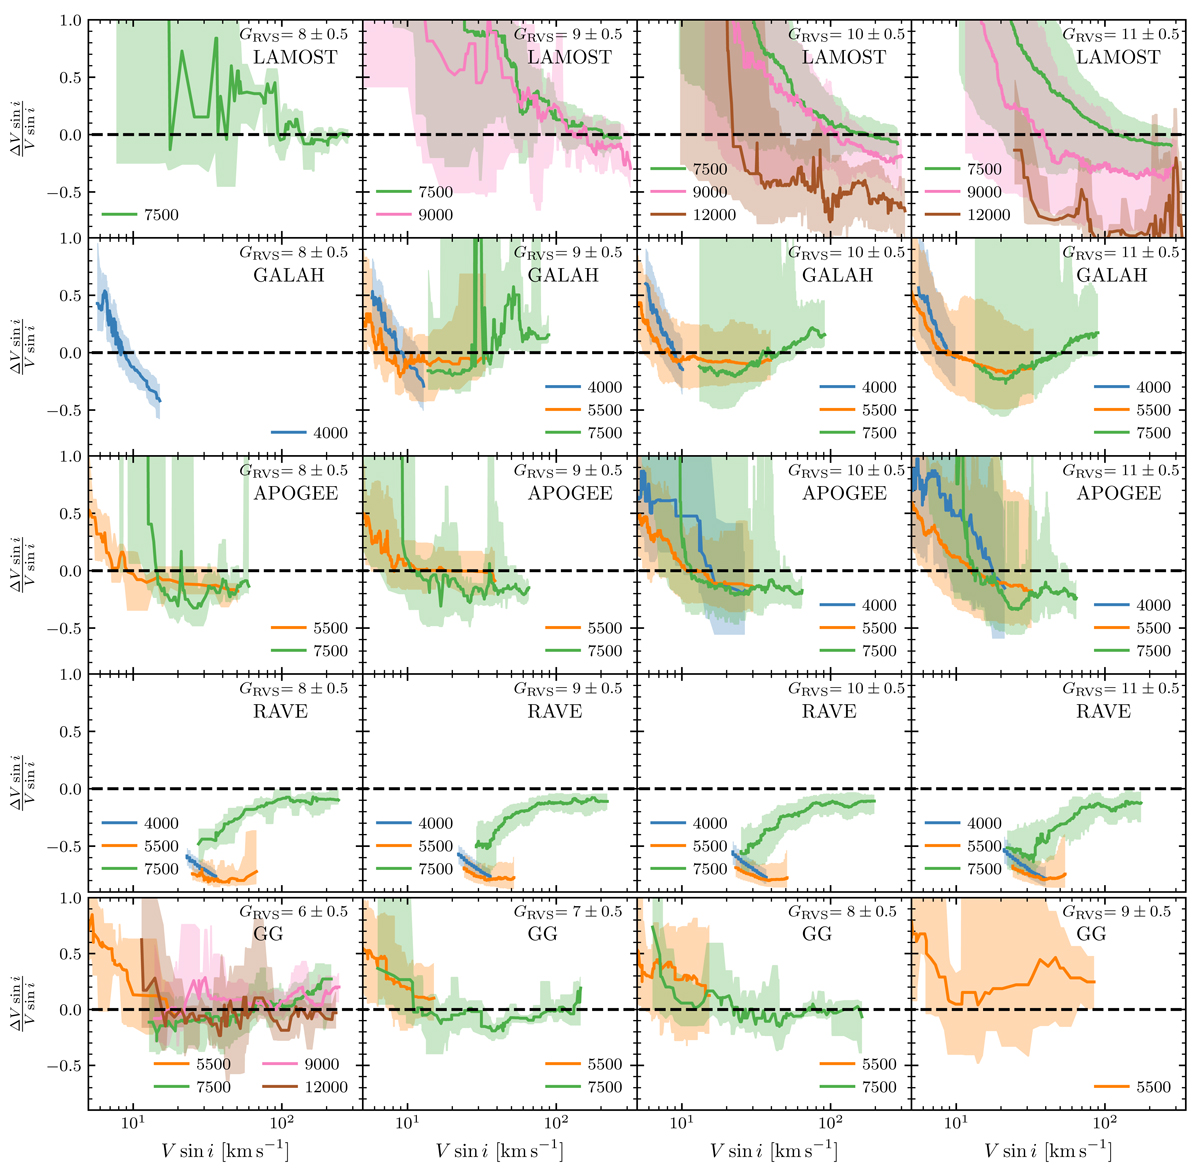
Fig. 12.
Download original image
Variation in relative residuals in vbroad as a function of the catalogue V sin i (ΔV sin i = vbroad − V sin i) for different ranges of effective temperature. The x-axis V sin i scales are from the comparison catalogues. From left to right: the panels inspect fainter ranges of magnitudes, 7.5–8.5, 8.5–9.5, and 9.5–10.5 mag, except for GG (last row), where the magnitude ranges are shifted 2 mag brighter. Thick lines represent the running median on the residuals, and the coloured regions correspond to the associated 15% and 85% quantiles. Each colour corresponds to the temperature given in the plots.
Current usage metrics show cumulative count of Article Views (full-text article views including HTML views, PDF and ePub downloads, according to the available data) and Abstracts Views on Vision4Press platform.
Data correspond to usage on the plateform after 2015. The current usage metrics is available 48-96 hours after online publication and is updated daily on week days.
Initial download of the metrics may take a while.