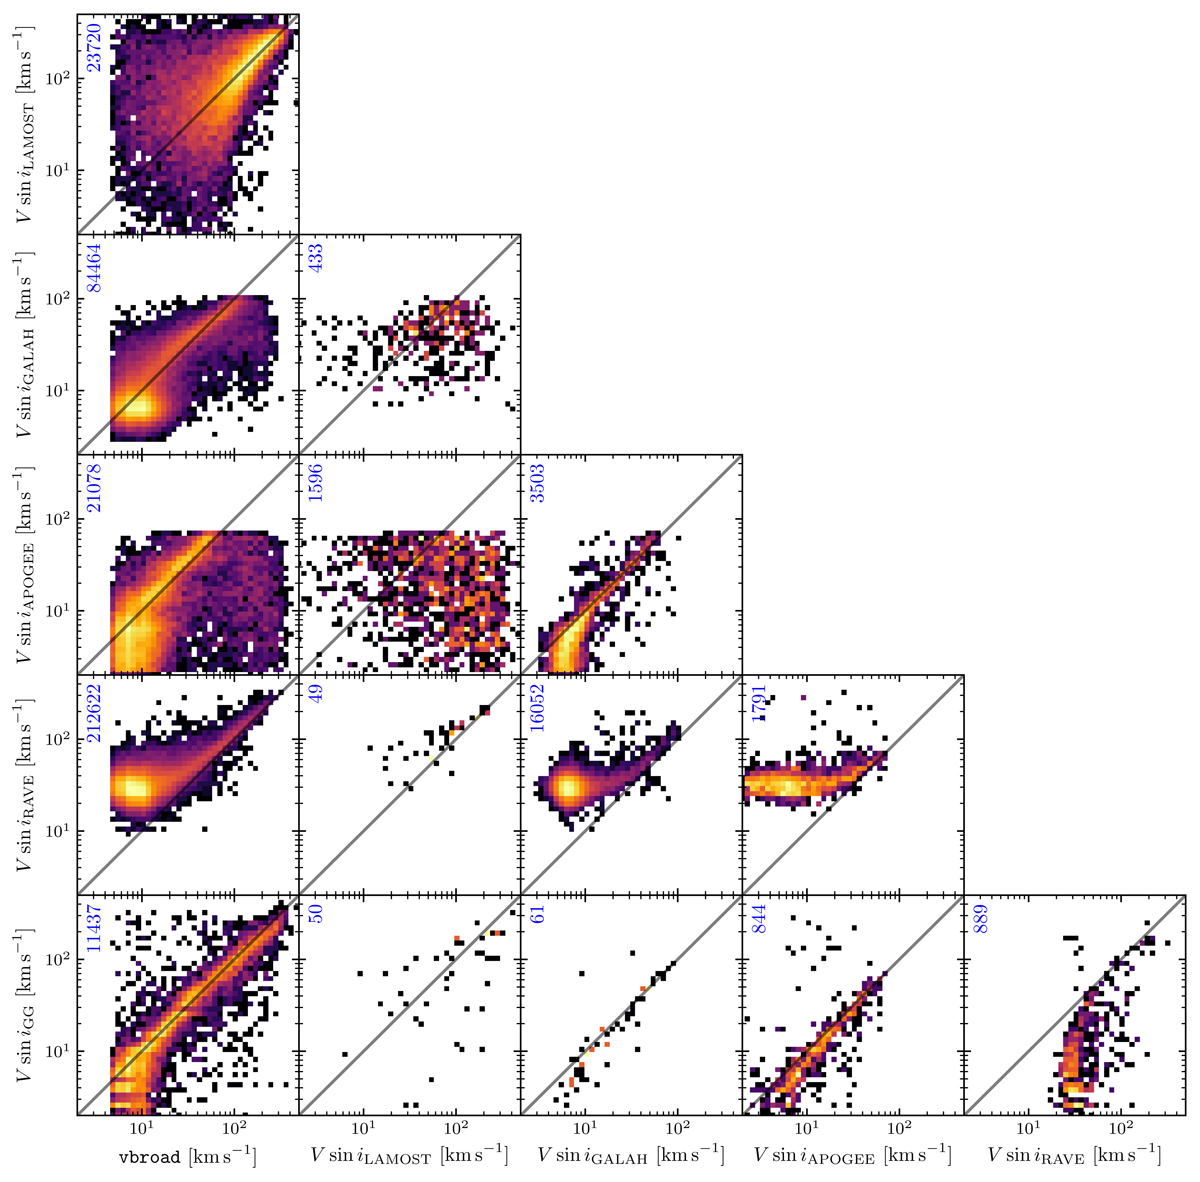
Fig. 11.
Download original image
Comparison with other catalogues: One-to-one comparisons of line-broadening measurements of the considered sources, including Gaia DR3. The velocity scales are logarithmic, as is the density colour scale. Sizes of comparison samples are indicated in the upper left corners, and the one-to-one relation is represented by the diagonal black line.
Current usage metrics show cumulative count of Article Views (full-text article views including HTML views, PDF and ePub downloads, according to the available data) and Abstracts Views on Vision4Press platform.
Data correspond to usage on the plateform after 2015. The current usage metrics is available 48-96 hours after online publication and is updated daily on week days.
Initial download of the metrics may take a while.