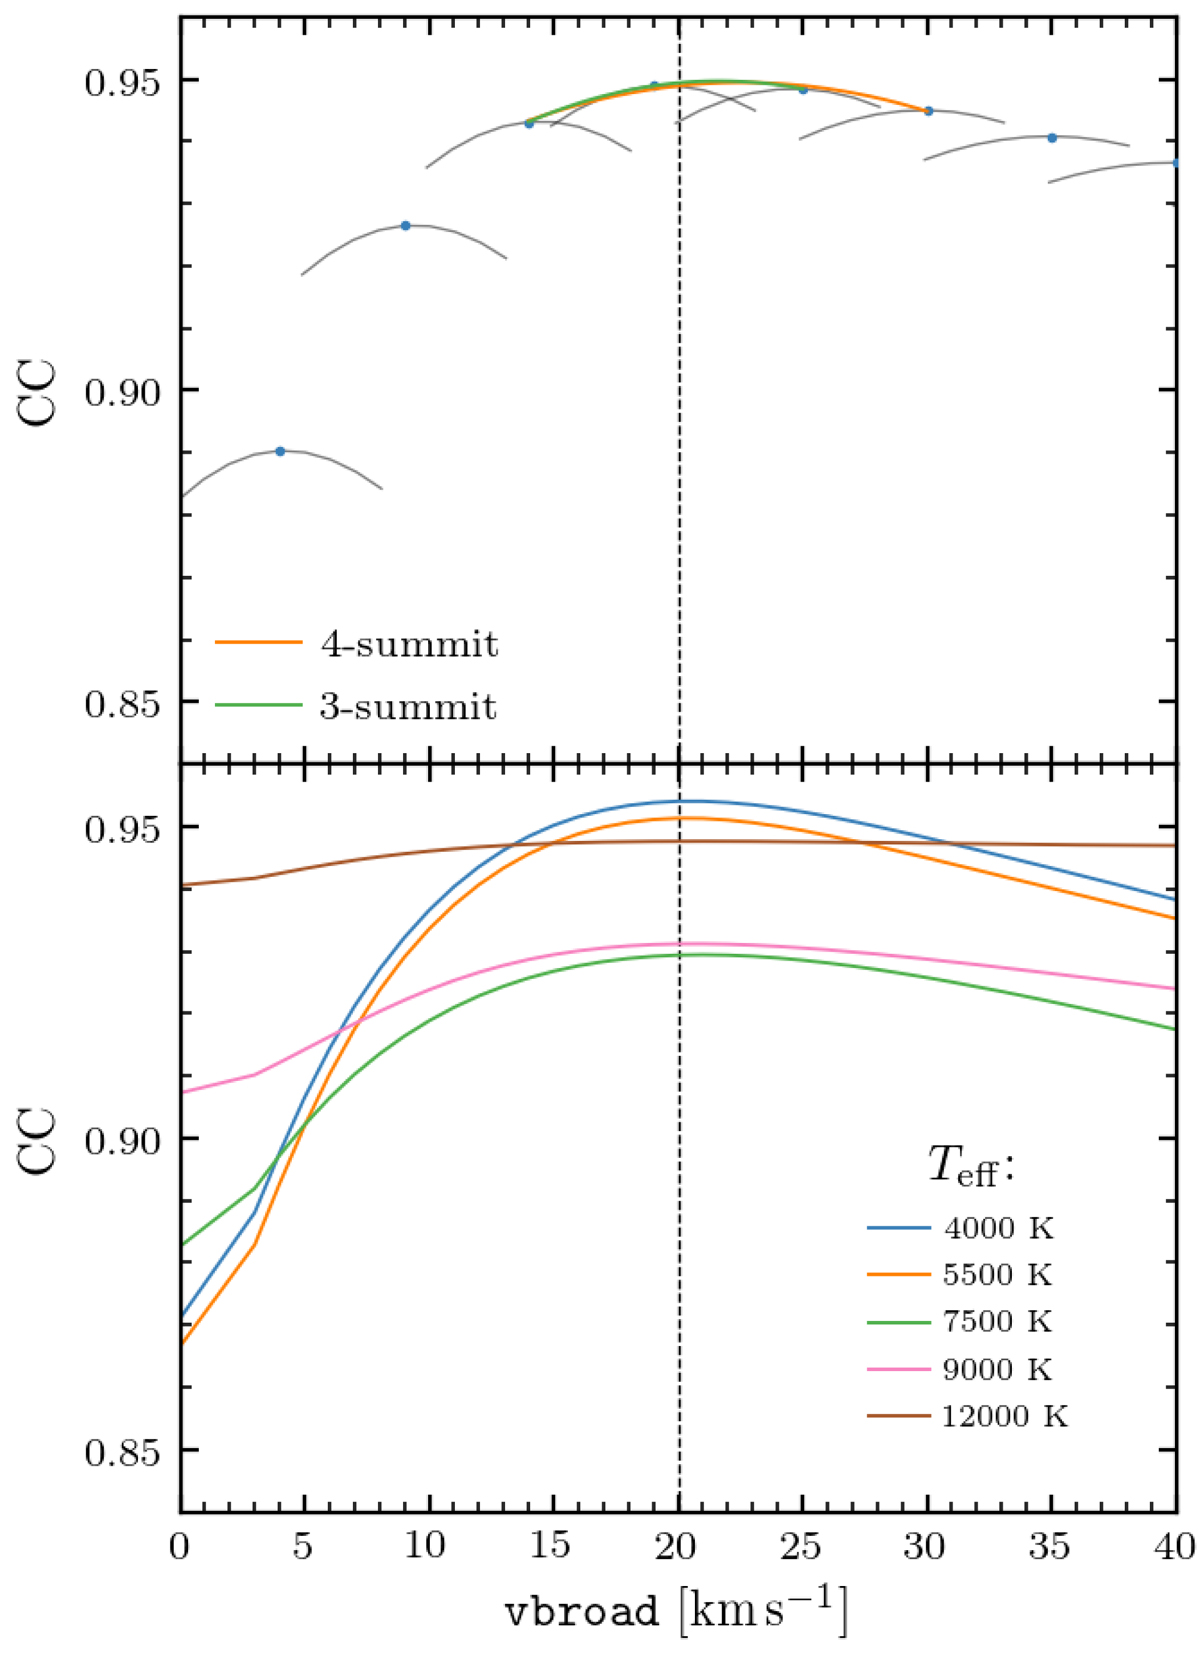
Fig. 1.
Download original image
vbroad determination at Teff = 5500 K, log g = 4.5, [Fe/H] = 0, vbroad = 20 km s−1 (vertical dashed line), and GRVS = 8. Template mismatch errors are ignored, except for the vbroad broadening, which is the quantity to be derived. Upper panel: top of the CCF centred at 0 km s−1 (grey curves) obtained by assuming various values of vbroad is plotted and shifted according to the adopted vbroad. The peaks are identified by blue circles, and the three-peak and four-peak parabola fits are shown by green and orange curves, respectively. The ordinate axis label ‘CC’ stands for ‘cross-correlation coefficient’. Lower panel: same as in the upper panel, but at different effective temperature values. For clarity, the CCF peaks are connected by a line.
Current usage metrics show cumulative count of Article Views (full-text article views including HTML views, PDF and ePub downloads, according to the available data) and Abstracts Views on Vision4Press platform.
Data correspond to usage on the plateform after 2015. The current usage metrics is available 48-96 hours after online publication and is updated daily on week days.
Initial download of the metrics may take a while.