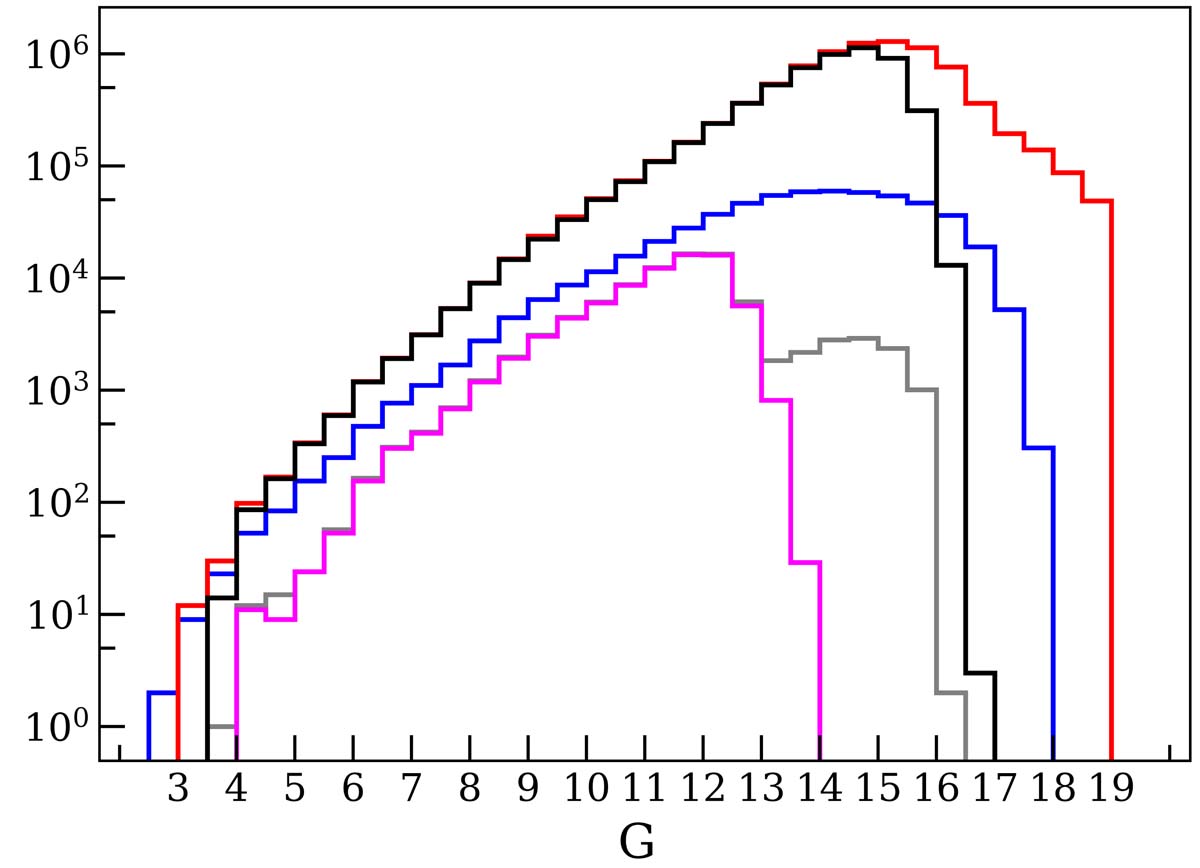
Fig. 3.
Download original image
G magnitude distribution of the selected giants (red) and OB (blue) samples. Black and grey histograms show the subsamples with line-of-sight velocities for the giants and OB stars, respectively. The magenta histogram are OB stars for which the line-of-sight velocities were estimated with templates with a Teff > 7000 K. This sample was selected for mapping the velocities of the OB stars.
Current usage metrics show cumulative count of Article Views (full-text article views including HTML views, PDF and ePub downloads, according to the available data) and Abstracts Views on Vision4Press platform.
Data correspond to usage on the plateform after 2015. The current usage metrics is available 48-96 hours after online publication and is updated daily on week days.
Initial download of the metrics may take a while.