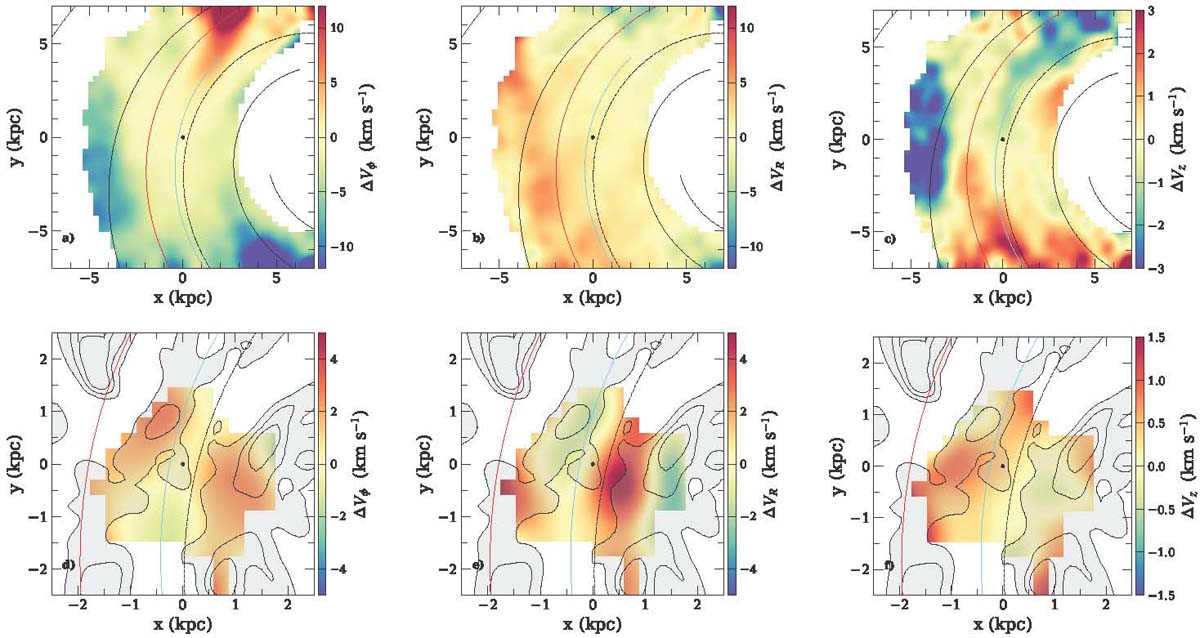
Fig. 23.
Download original image
Heliocentric maps of ΔVi, i.e. (VZ > 0 − VZ < 0), for the components i = ϕ, R, Z, in the RGB sample (top) and the OB star sample (bottom). The NIR two-arm spiral model (black) from Drimmel (2000) is overplotted as well as are the Perseus (red), and the Local (cyan) Arms model from Reid et al. (2019). The position of the Sun is indicated by the black dot at (x, y) = (0, 0).
Current usage metrics show cumulative count of Article Views (full-text article views including HTML views, PDF and ePub downloads, according to the available data) and Abstracts Views on Vision4Press platform.
Data correspond to usage on the plateform after 2015. The current usage metrics is available 48-96 hours after online publication and is updated daily on week days.
Initial download of the metrics may take a while.