Fig. 22.
Download original image
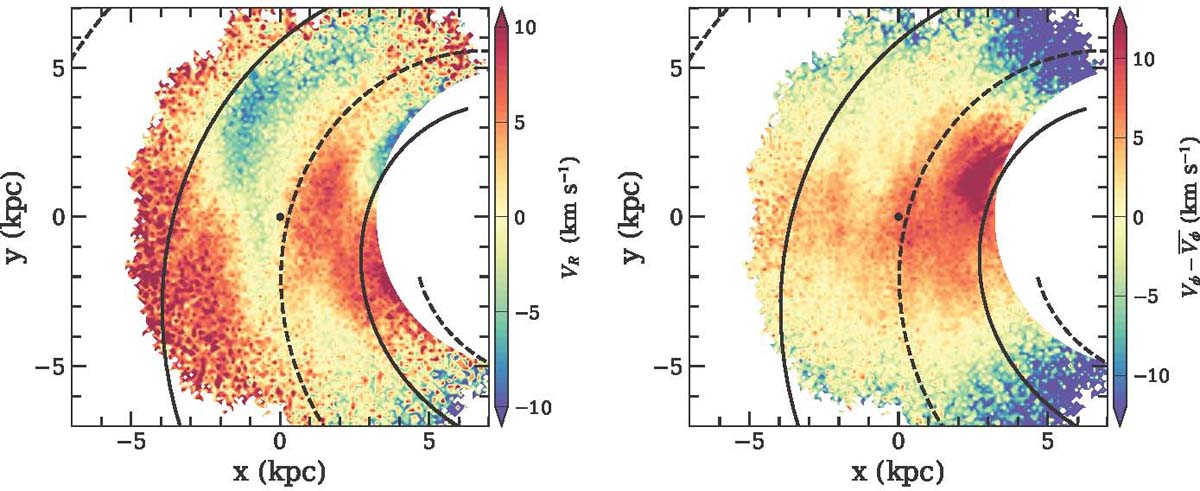
Velocity maps for the RGB sample. Left panel: inferred radial velocity, VR. Right panel: map for ![]() , i.e. the residual azimuthal velocity. Overlaid on both maps is the two-arm NIR spiral model from Drimmel (2000), shown as solid lines. The dashed lines correspond to the minimum inter-arm density (see text). The position of the Sun is marked by a black dot.
, i.e. the residual azimuthal velocity. Overlaid on both maps is the two-arm NIR spiral model from Drimmel (2000), shown as solid lines. The dashed lines correspond to the minimum inter-arm density (see text). The position of the Sun is marked by a black dot.
Current usage metrics show cumulative count of Article Views (full-text article views including HTML views, PDF and ePub downloads, according to the available data) and Abstracts Views on Vision4Press platform.
Data correspond to usage on the plateform after 2015. The current usage metrics is available 48-96 hours after online publication and is updated daily on week days.
Initial download of the metrics may take a while.