Fig. 21.
Download original image
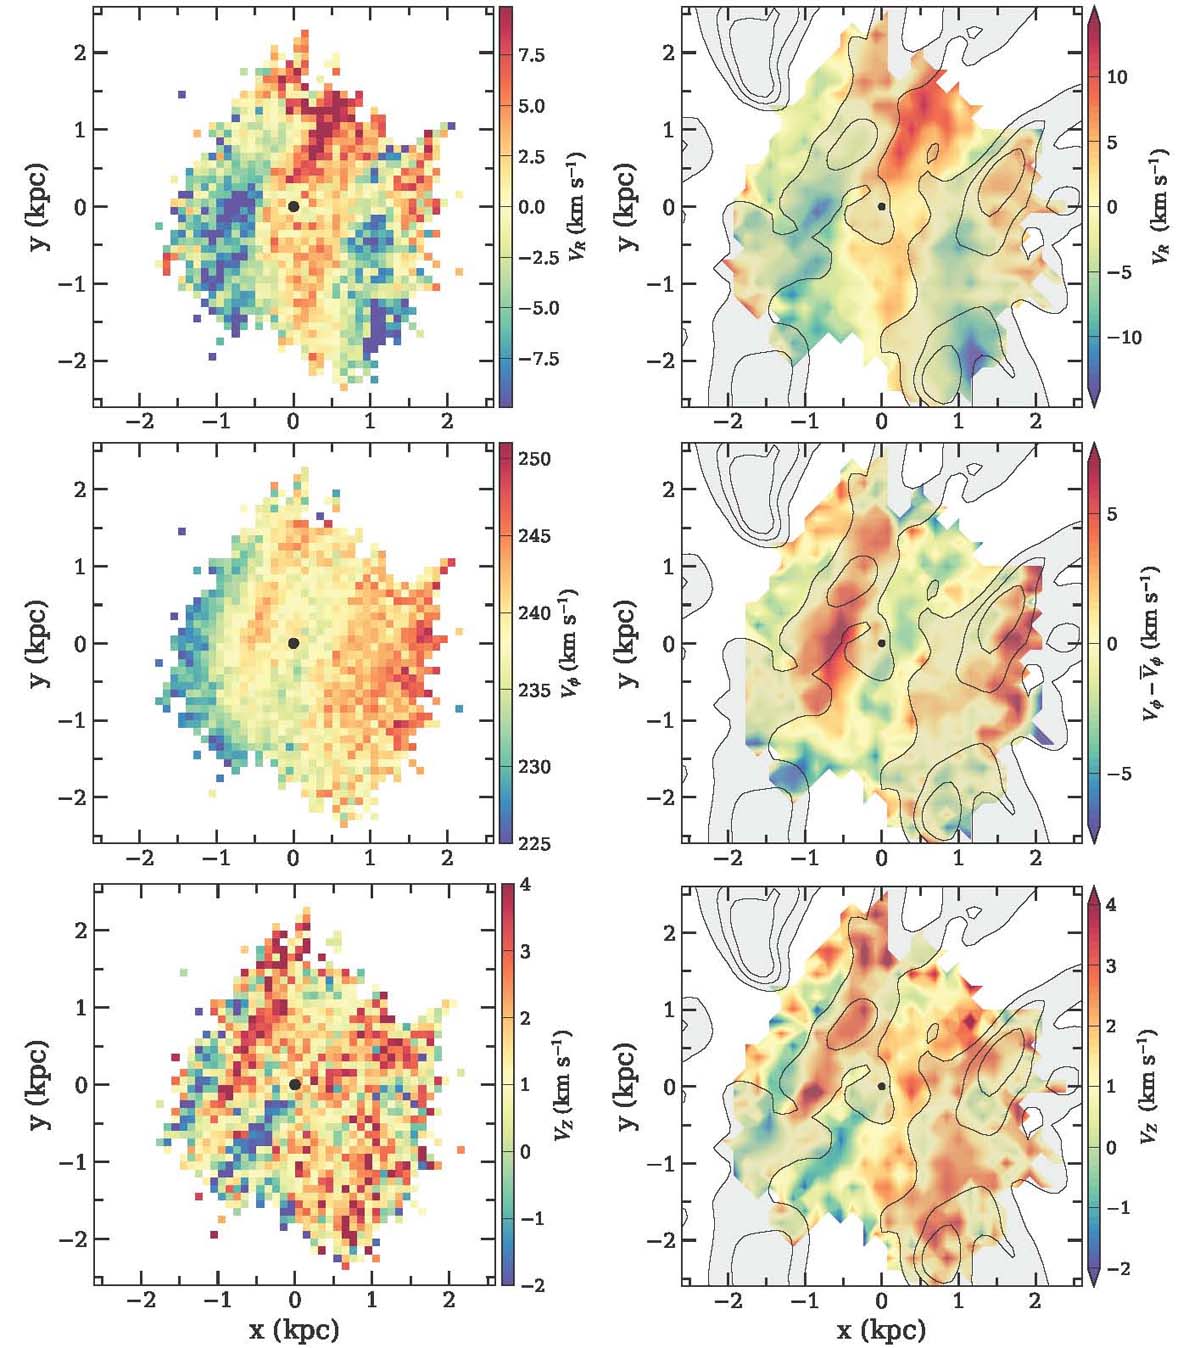
Velocity maps of OB stars. Left panels: inferred radial, azimuthal, and vertical velocity from top to bottom. The velocity ranges have been chosen to enhance contrasts. Right panels: maps of the radial velocity (top panel), the azimuthal residual velocity (middle panel), and the vertical velocity (bottom panel), compared to the overdensity contours of the OB stars (grey shaded areas), calculated as explained in Sect. 3.1. In all panels, the position of the Sun is marked by a filled circle. The maps were obtained considering only stars within |z|≤0.3 kpc. The velocity and maps (left-hand column) can be found at the CDS in FITS format.
Current usage metrics show cumulative count of Article Views (full-text article views including HTML views, PDF and ePub downloads, according to the available data) and Abstracts Views on Vision4Press platform.
Data correspond to usage on the plateform after 2015. The current usage metrics is available 48-96 hours after online publication and is updated daily on week days.
Initial download of the metrics may take a while.