Fig. 20.
Download original image
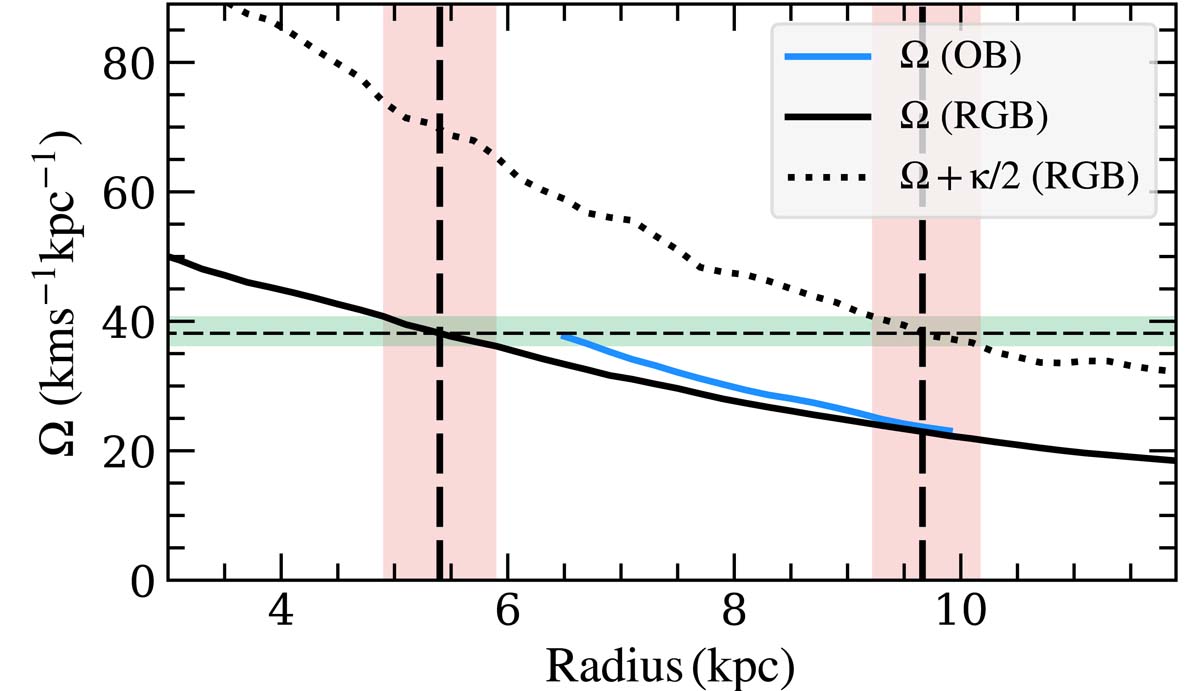
Lindblad resonances of the Galactic bar. The solid (dotted) black line shows the angular frequency (angular frequency plus half of the epicyclic frequency) for the RGB stars, and the solid blue line shows the angular frequency for the OB stars. The horizontal dashed line represents the bar pattern speed, and the two vertical dashed lines at R = 5.4 and 9.7 kpc, with their uncertainty range in purple, are the location ranges of the corotation and outer Lindblad resonance, respectively.
Current usage metrics show cumulative count of Article Views (full-text article views including HTML views, PDF and ePub downloads, according to the available data) and Abstracts Views on Vision4Press platform.
Data correspond to usage on the plateform after 2015. The current usage metrics is available 48-96 hours after online publication and is updated daily on week days.
Initial download of the metrics may take a while.