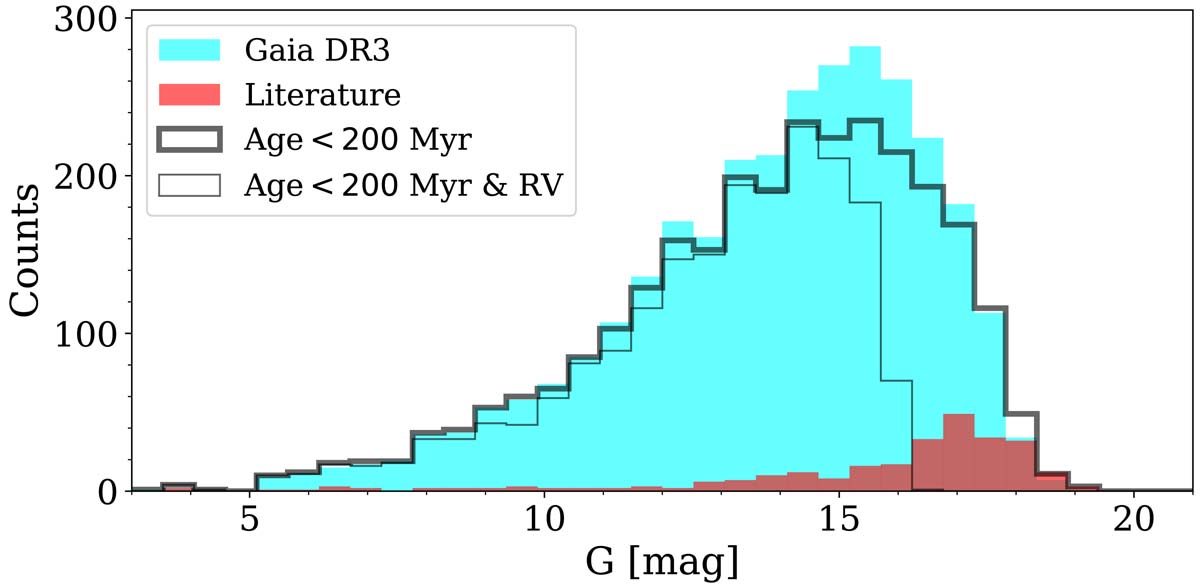
Fig. 2.
Download original image
Histogram of the G magnitude for the DCEP sample. We plot in cyan and red the histograms for the objects from the Gaia DR3 catalogue and those taken from the literature, respectively. The thick line shows the magnitude distribution of the DCEPs after the selection in age (< 200 Gyr), while the thin line shows the histogram of the objects selected in age that also possess a line-of-sight velocity measurement. In the last two cases, the Gaia DR3 and literature samples were merged.
Current usage metrics show cumulative count of Article Views (full-text article views including HTML views, PDF and ePub downloads, according to the available data) and Abstracts Views on Vision4Press platform.
Data correspond to usage on the plateform after 2015. The current usage metrics is available 48-96 hours after online publication and is updated daily on week days.
Initial download of the metrics may take a while.