Fig. 19.
Download original image
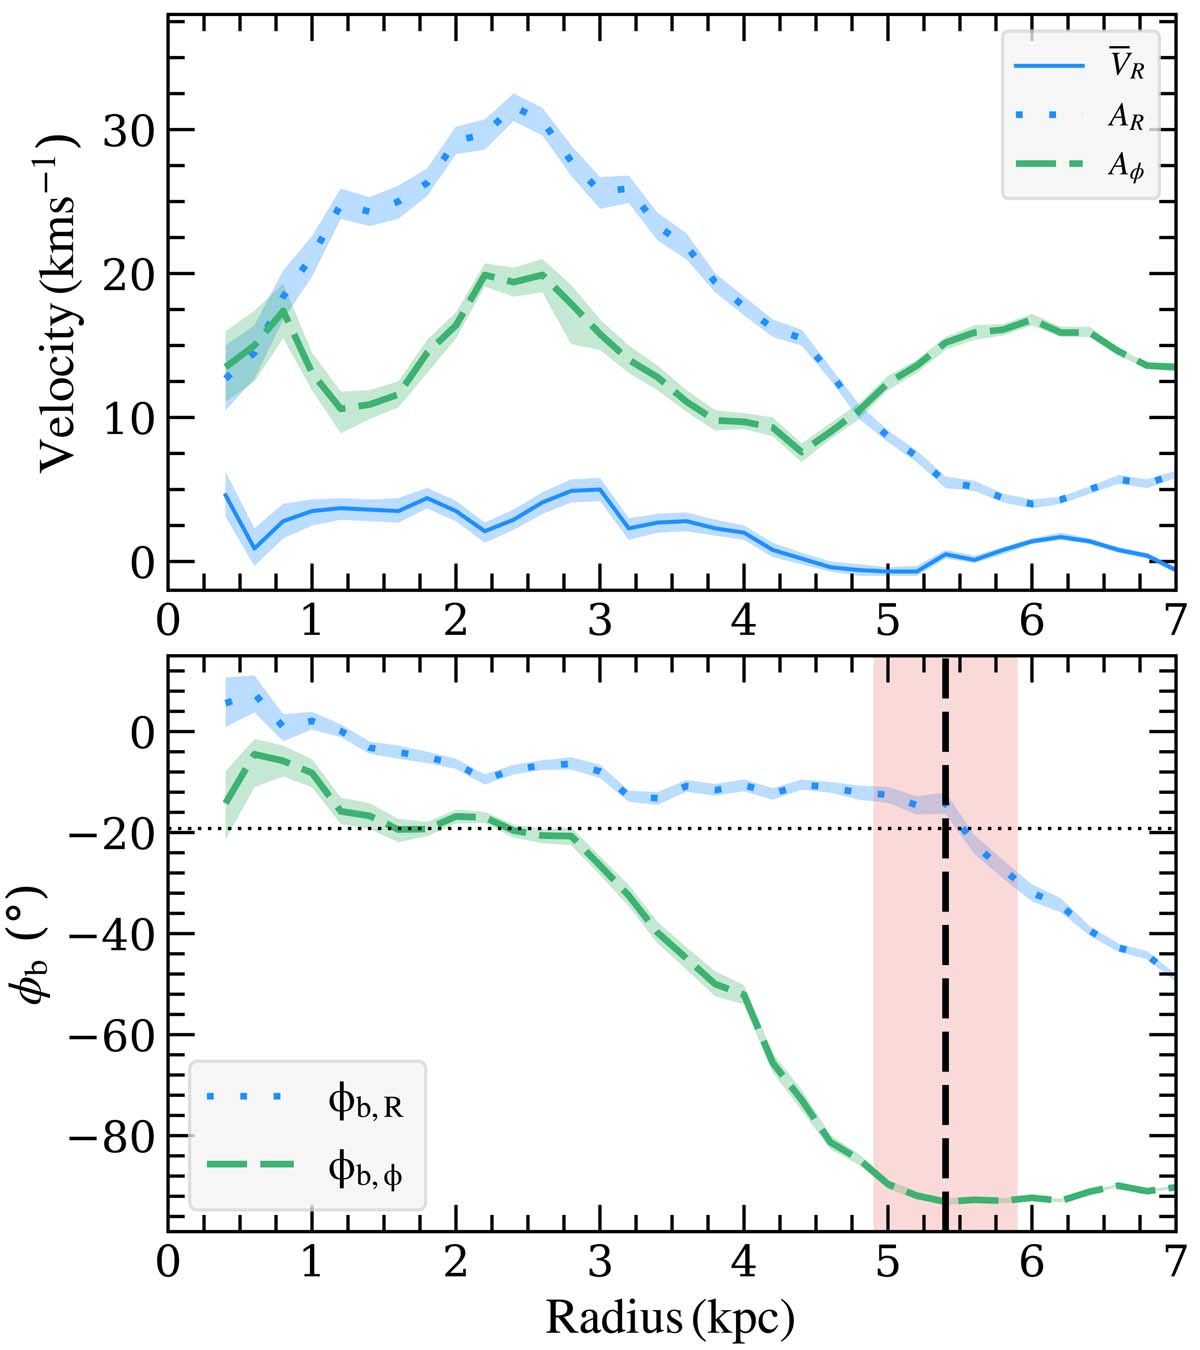
Results of the bisymmetric model of the VR and Vϕ velocity maps. Top: amplitudes AR and Aϕ of the bisymmetry. The axisymmetric component ![]() is also shown. Bottom: phase angle of the perturbation with respect to the Sun-GC direction. The shaded area represents the uncertainties. The horizontal dotted line marks the estimated bar orientation angle. The vertical dashed line and purple area show the estimated location of the bar corotation.
is also shown. Bottom: phase angle of the perturbation with respect to the Sun-GC direction. The shaded area represents the uncertainties. The horizontal dotted line marks the estimated bar orientation angle. The vertical dashed line and purple area show the estimated location of the bar corotation.
Current usage metrics show cumulative count of Article Views (full-text article views including HTML views, PDF and ePub downloads, according to the available data) and Abstracts Views on Vision4Press platform.
Data correspond to usage on the plateform after 2015. The current usage metrics is available 48-96 hours after online publication and is updated daily on week days.
Initial download of the metrics may take a while.