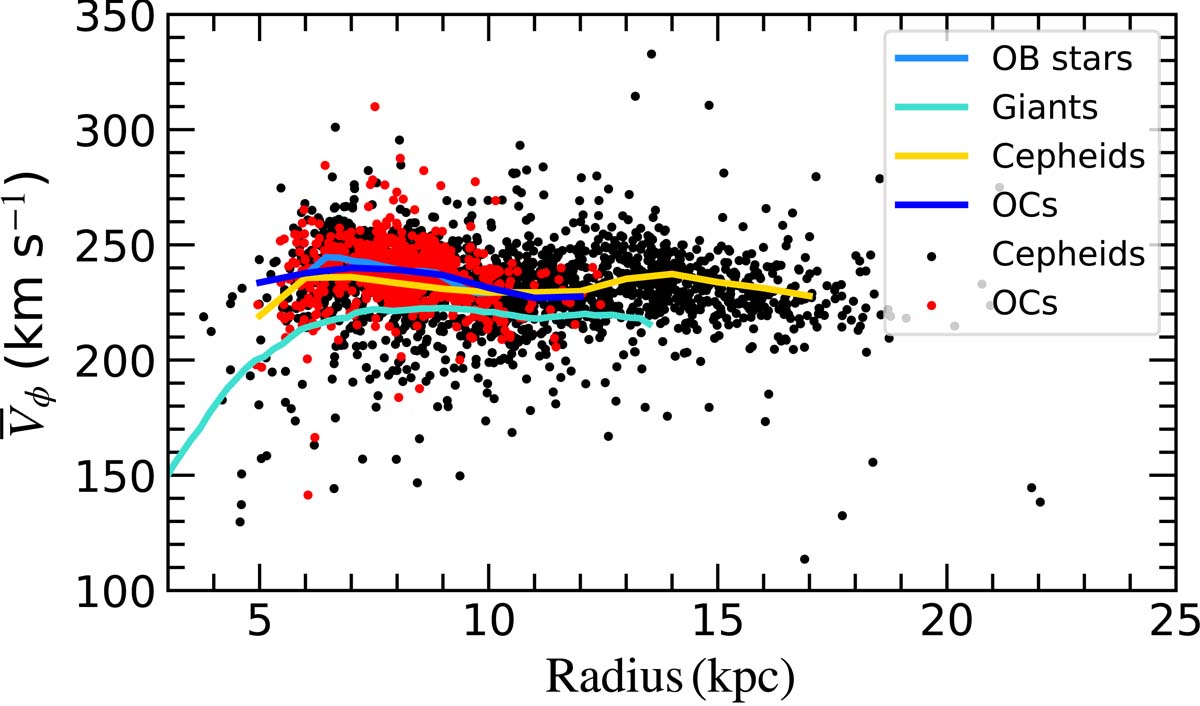
Fig. 18.
Download original image
Comparison of rotation curves of the different samples. We show the mean azimuthal velocity for the open clusters (dark blue) and Cepheids (yellow) as a function of galactocentric radius (calculated as explained in the text), compared to the profiles of the OB (light blue) and RGB stars (turquoise). Coloured points show the single sources for the Cepheids (black dots) and OCs (red points).
Current usage metrics show cumulative count of Article Views (full-text article views including HTML views, PDF and ePub downloads, according to the available data) and Abstracts Views on Vision4Press platform.
Data correspond to usage on the plateform after 2015. The current usage metrics is available 48-96 hours after online publication and is updated daily on week days.
Initial download of the metrics may take a while.