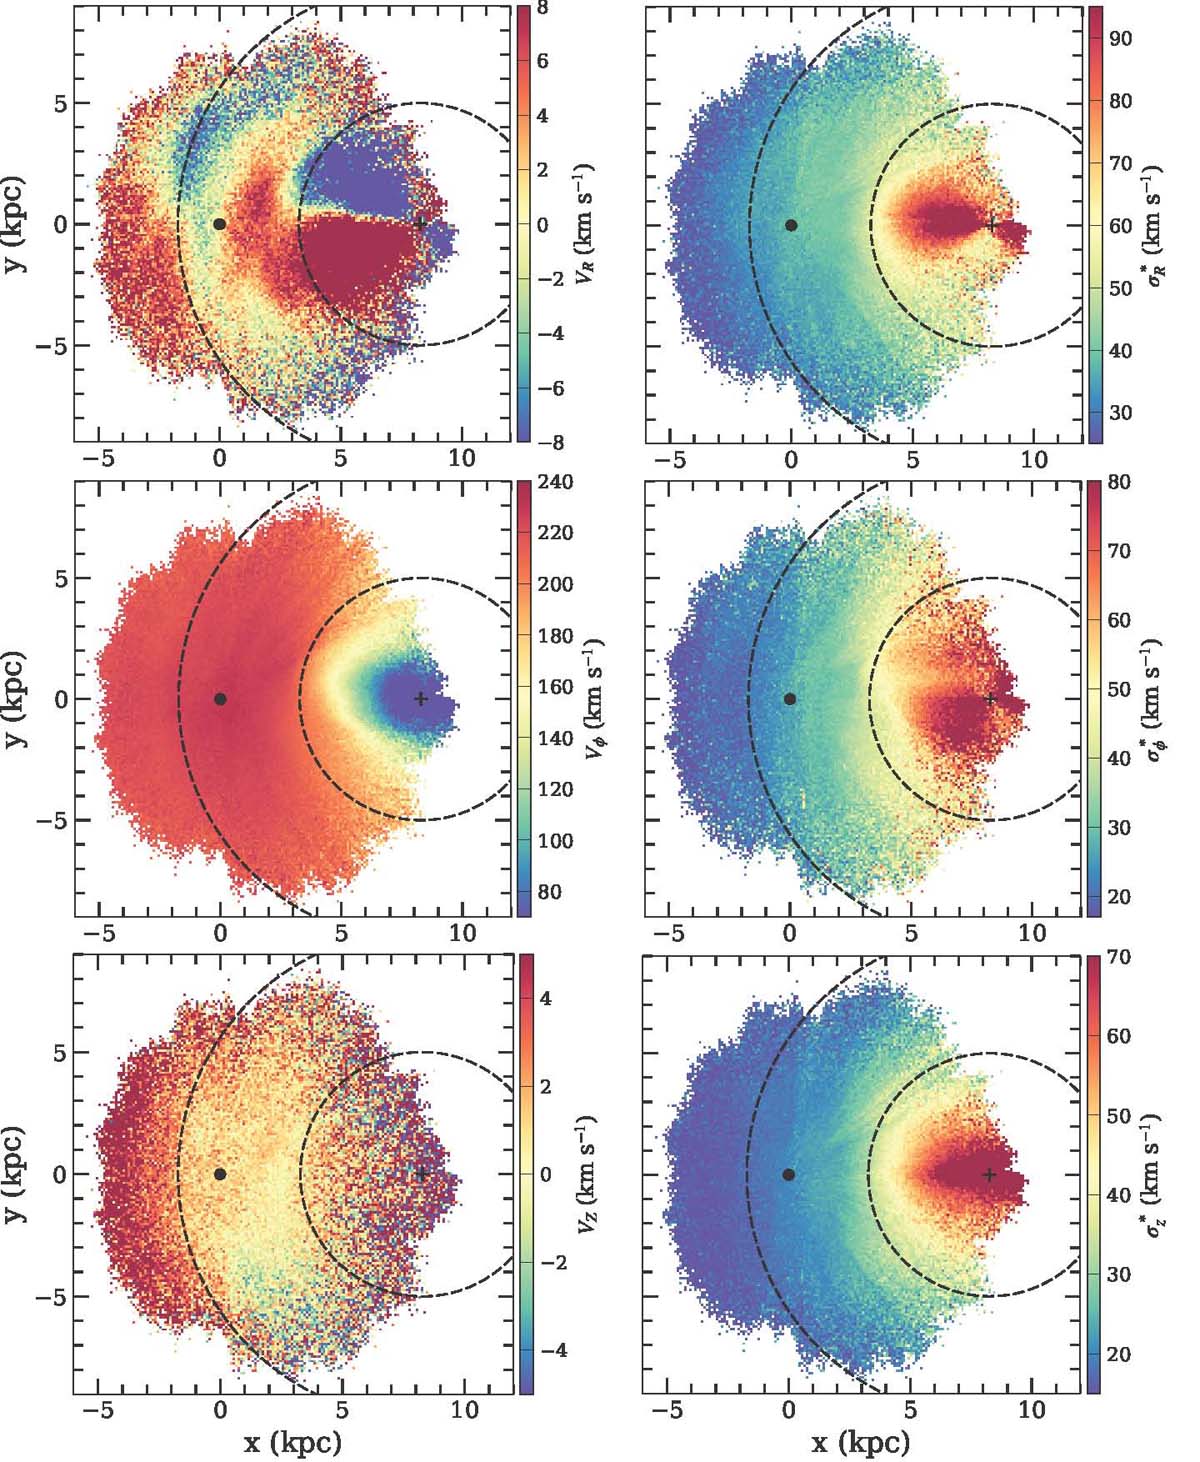
Fig. 16.
Download original image
Velocity maps of RGB stars. Left and right panels: ordered and random motions, respectively. From top to bottom panels: radial, azimuthal, and vertical velocity components. The origin, emphasised by the black dot, indicates the position of the Sun, and a plus symbol indicates the Galactic centre. Dashed circles represent the constant distance to the Galactic centre at R = 5 and R = 10 kpc. The velocity ranges have been chosen to enhance contrasts to help visually identify regions in which streaming motions occur. The left panels of Fig. B.1 show the associated uncertainty maps. We detail the construction of these maps in Sect. 5.1. These velocity and velocity dispersion maps can be found at the CDS in FITS format.
Current usage metrics show cumulative count of Article Views (full-text article views including HTML views, PDF and ePub downloads, according to the available data) and Abstracts Views on Vision4Press platform.
Data correspond to usage on the plateform after 2015. The current usage metrics is available 48-96 hours after online publication and is updated daily on week days.
Initial download of the metrics may take a while.