Open Access
Fig. 15.
Download original image
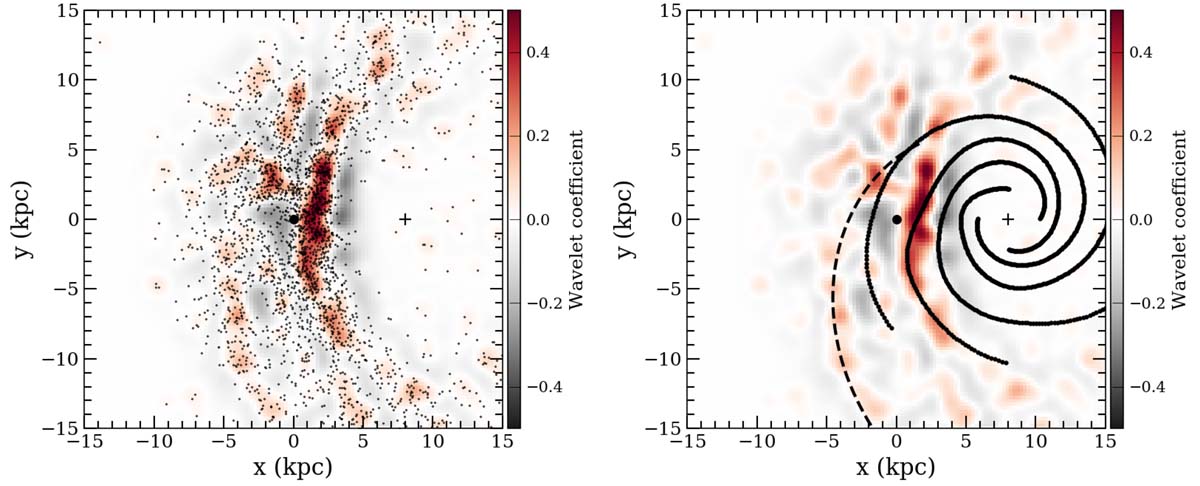
Wavelet transformation of the Cepheids with age < 200 Myr. Black dots in the left panel show the positions of the single sources, and the right panel shows on a larger scale an overlay of the model from Taylor & Cordes (1993, solid lines) and the model from Levine et al. (2006, dashed line).
Current usage metrics show cumulative count of Article Views (full-text article views including HTML views, PDF and ePub downloads, according to the available data) and Abstracts Views on Vision4Press platform.
Data correspond to usage on the plateform after 2015. The current usage metrics is available 48-96 hours after online publication and is updated daily on week days.
Initial download of the metrics may take a while.