Open Access
Fig. 13.
Download original image
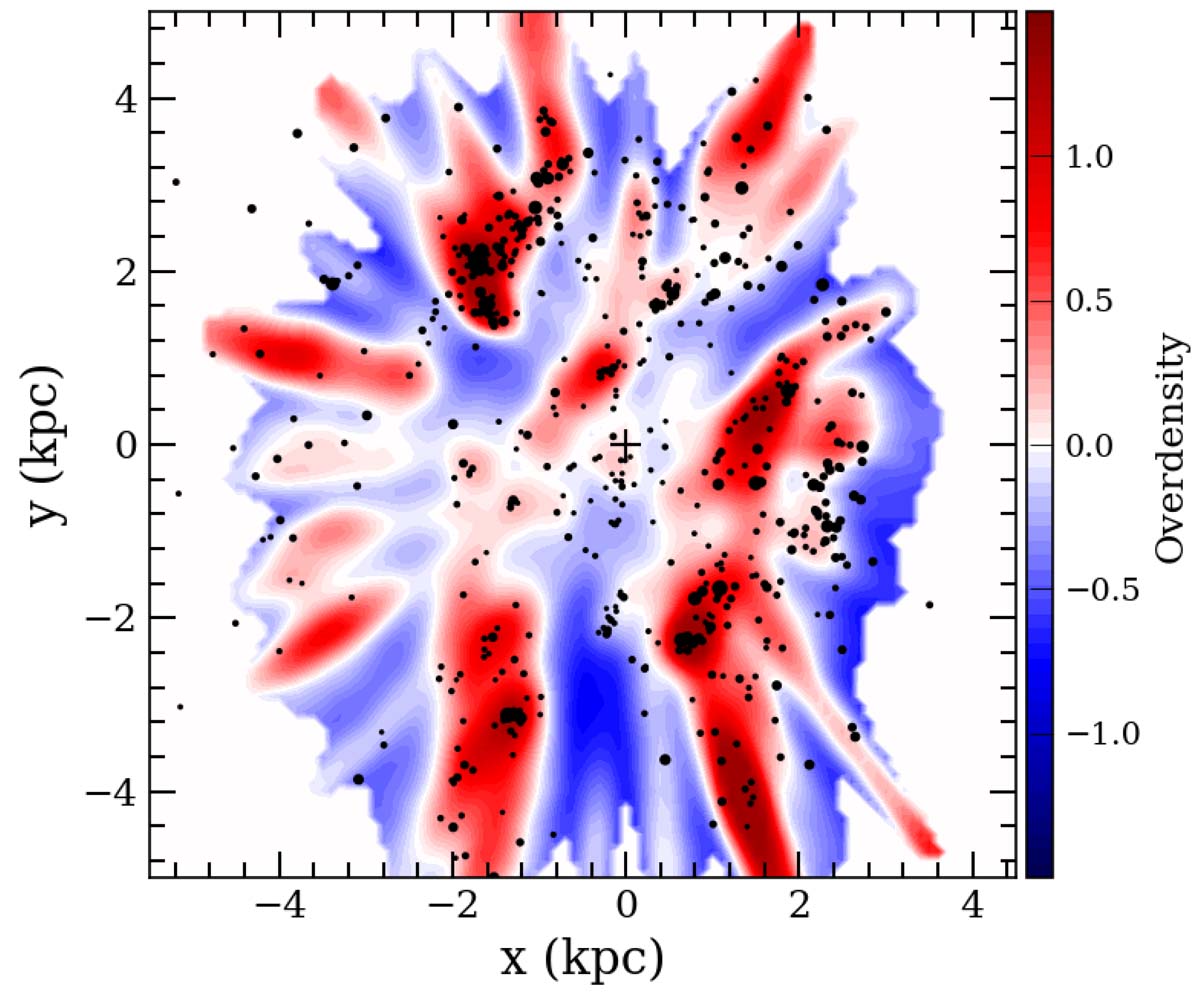
Overdensity map of the OB stars overplotted with the positions of the open clusters younger than 63 Myr and with n0 > 5, plotted with filled circles whose size is proportional to ![]() . The cross indicates the position of the Sun.
. The cross indicates the position of the Sun.
Current usage metrics show cumulative count of Article Views (full-text article views including HTML views, PDF and ePub downloads, according to the available data) and Abstracts Views on Vision4Press platform.
Data correspond to usage on the plateform after 2015. The current usage metrics is available 48-96 hours after online publication and is updated daily on week days.
Initial download of the metrics may take a while.