Fig. 11.
Download original image
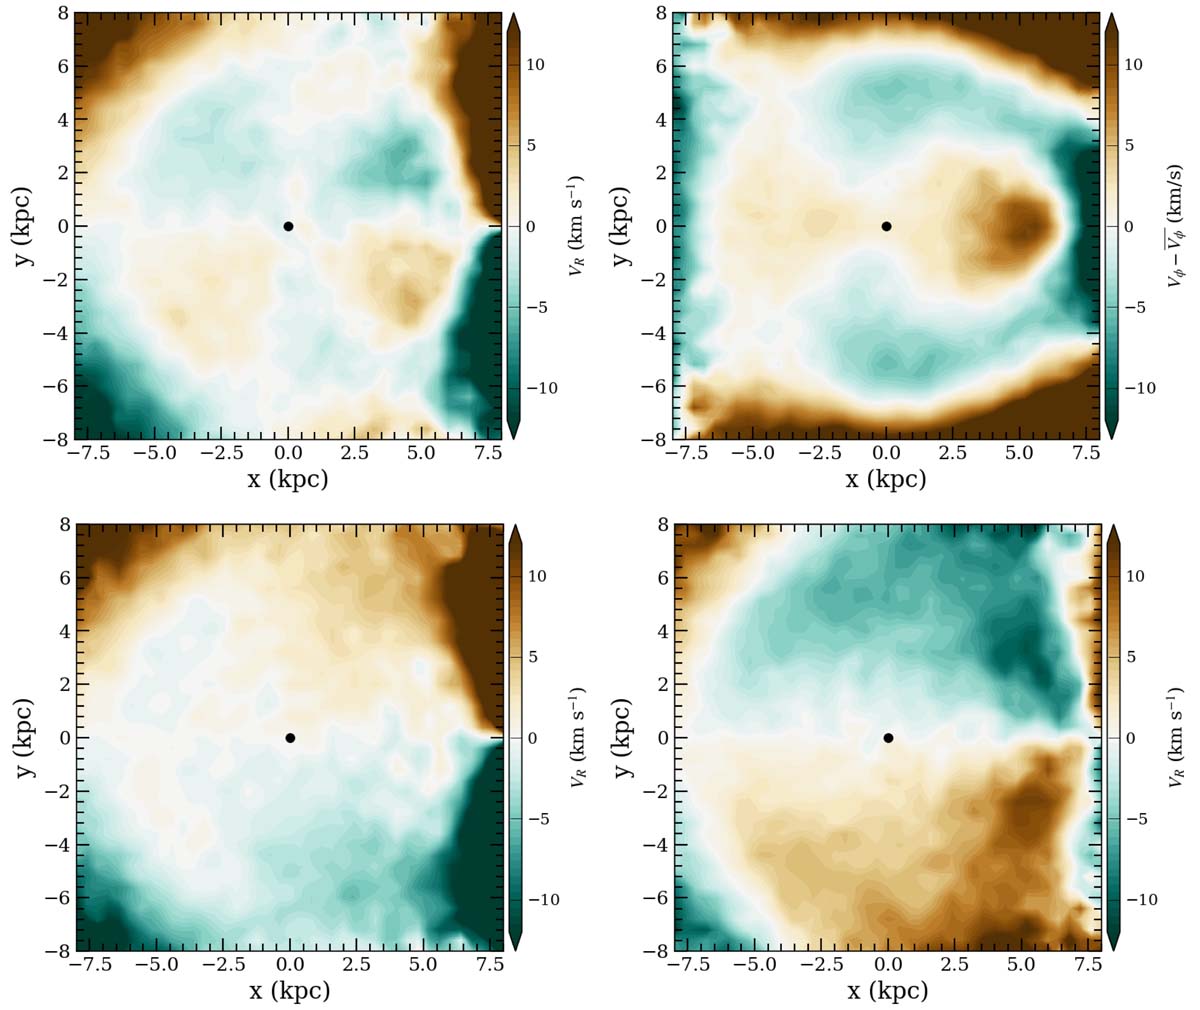
Systematic velocity trends induced by the simulated uncertainties in our mock catalogue. Upper left panel: map of the observed VR assuming a relative parallax uncertainty = 0.2. Upper right panel: same as the left panel, but showing the observed ΔVϕ. Lower left panel: observed VR assuming that the true value of R⊙ is 200 pc higher than the adopted value, together with the distance uncertainty model explained in the text. Lower right panel: observed VR assuming that the true value of the solar velocity component Vϕ, ⊙ is 10 km s−1 higher than the adopted value, together with the distance uncertainty model explained in the text.
Current usage metrics show cumulative count of Article Views (full-text article views including HTML views, PDF and ePub downloads, according to the available data) and Abstracts Views on Vision4Press platform.
Data correspond to usage on the plateform after 2015. The current usage metrics is available 48-96 hours after online publication and is updated daily on week days.
Initial download of the metrics may take a while.