Open Access
Fig. 10.
Download original image
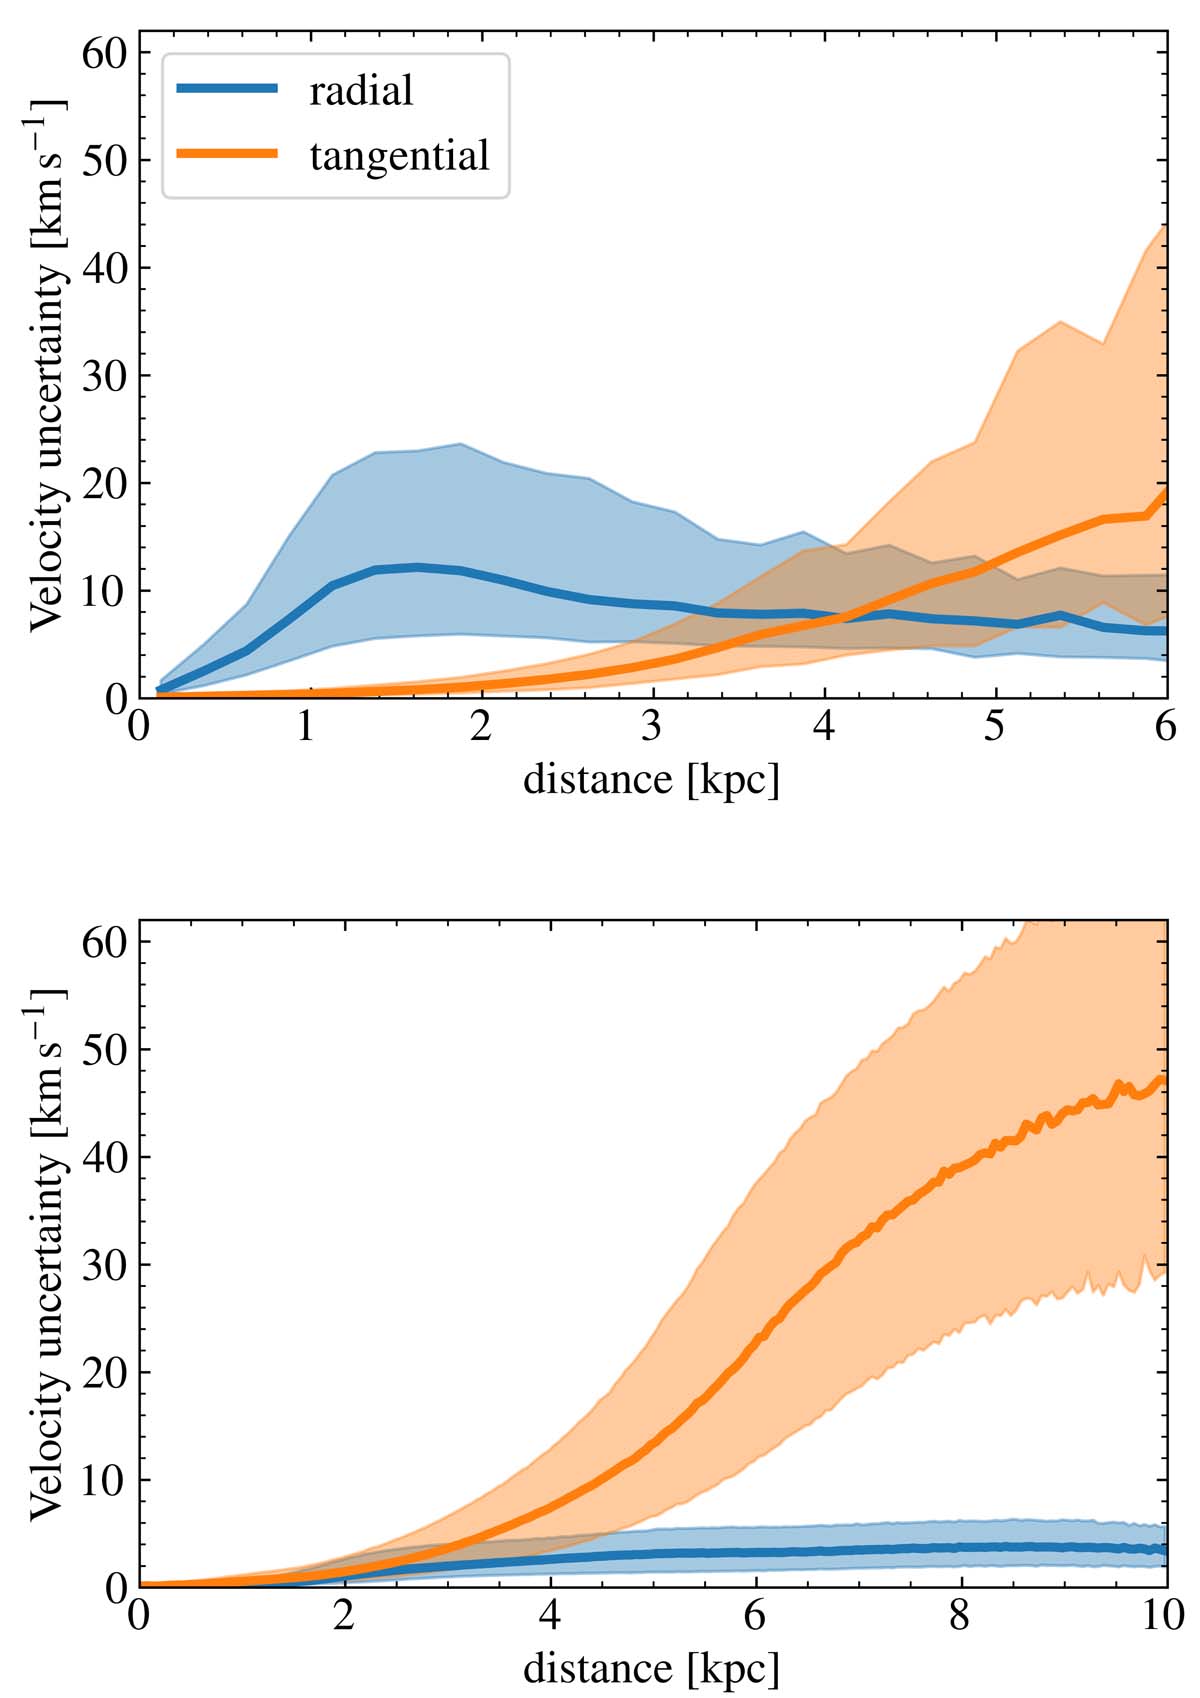
Median radial (blue) and tangential (orange) velocity uncertainties of the individual sources as a function of distances. The shaded areas show the range between the 16th and 84th percentiles. The upper plot shows the OB stars, and the lower plot shows the RGB stars for the samples with full velocity information.
Current usage metrics show cumulative count of Article Views (full-text article views including HTML views, PDF and ePub downloads, according to the available data) and Abstracts Views on Vision4Press platform.
Data correspond to usage on the plateform after 2015. The current usage metrics is available 48-96 hours after online publication and is updated daily on week days.
Initial download of the metrics may take a while.