Open Access
Fig. 7.
Download original image
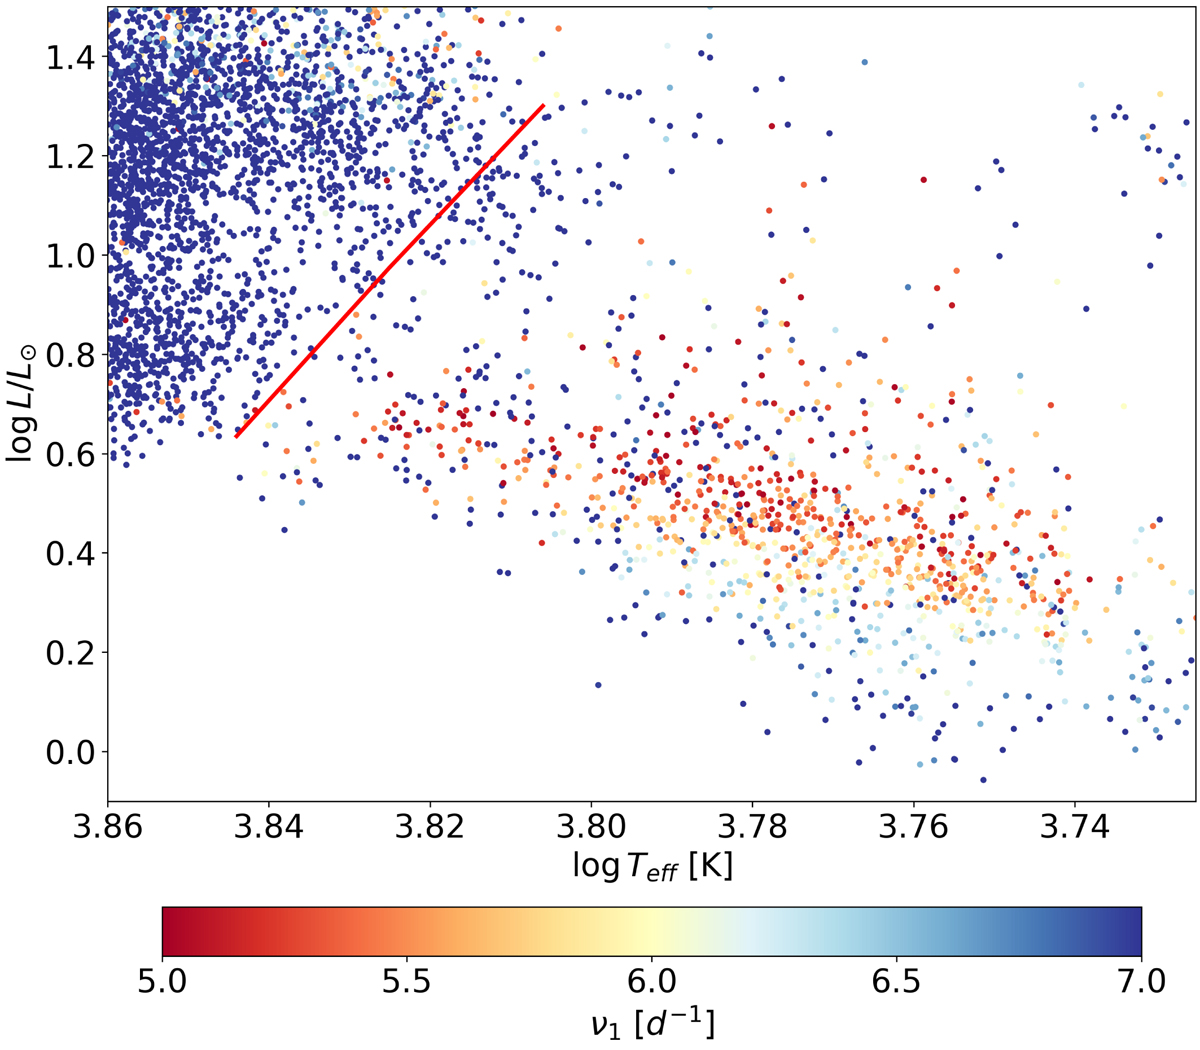
Zoom into the overdensity below the δ Sct instability strip at lower effective temperatures in the HR diagram shown in Fig. 6. The red line is the red edge of the δ Sct instability strip for n = 1 modes.
Current usage metrics show cumulative count of Article Views (full-text article views including HTML views, PDF and ePub downloads, according to the available data) and Abstracts Views on Vision4Press platform.
Data correspond to usage on the plateform after 2015. The current usage metrics is available 48-96 hours after online publication and is updated daily on week days.
Initial download of the metrics may take a while.