Open Access
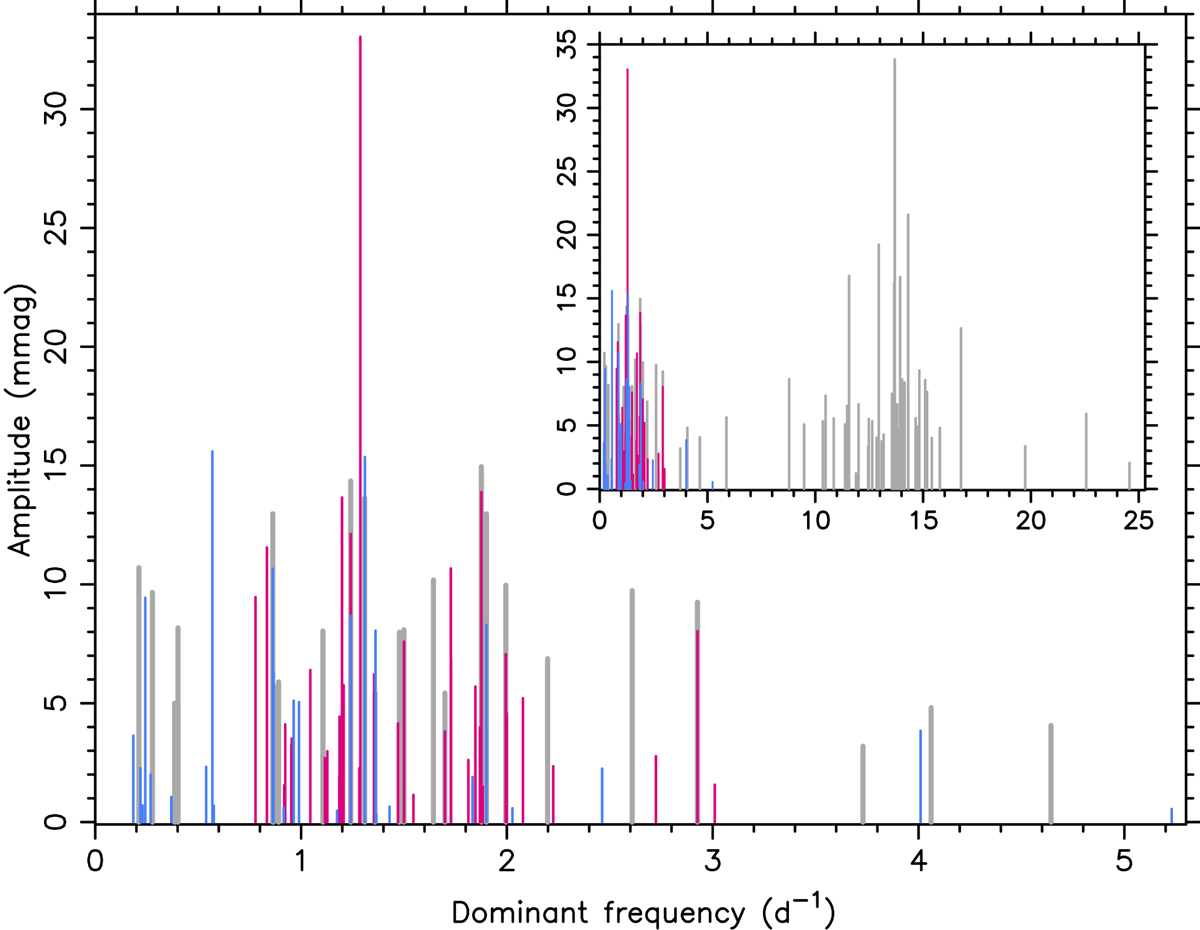
Fig. B.2.
Download original image
Amplitudes of the dominant frequencies in the Gaia G-band DR3 light curves (grey) and in the Kepler light curves of the γ Dor (pink) and SPB (blue) pulsators. The inset shows the entire frequency range, while the main panel focuses on the range of the true dominant g-mode frequencies of the 63 stars.
Current usage metrics show cumulative count of Article Views (full-text article views including HTML views, PDF and ePub downloads, according to the available data) and Abstracts Views on Vision4Press platform.
Data correspond to usage on the plateform after 2015. The current usage metrics is available 48-96 hours after online publication and is updated daily on week days.
Initial download of the metrics may take a while.